• Unlock your edge with a PFF+ subscription: Get full access to all our in-season fantasy tools, including weekly rankings, WR/CB matchup charts, weekly projections, the Start-Sit Optimizer and more. Sign up now!
Estimated reading time: 6 minutes
Welcome to the latest installment to my “Coach, I was Open” series exploring the weekly implications of my XGBOOST Predicted Targets model. This was created using route-level PFF data trying to predict every route’s probability of being targeted on every single play in the NFL. We can use this model to create some interesting metrics, like Share of Predicted Targets and Share of Predicted Air Yards. Both metrics are more stable and predictive than their actual counterparts.
My basic thesis on creating this model was that a player might be “earning targets” by being open and running valuable routes, but simply not garnering a target for whatever reason (pressure, misread by the QB, QB forcing the ball to a certain player, etc). Every Week N, the team reviews the film, likely notices a player was open and probably should have gotten more targets. Team then adjusts for this in Week N+1.
Later in this article, we are going to explore what’s going on with Caleb Williams and the Bears’ wide receivers.
Week 10 Recap:
Ja’Marr Chase put together an absolutely stellar performance on Thursday Night Football last week. Not to be lost in his excellent performance was his season high in targets (17) after showing up as last week’s headline player for “Coach, I was Open.”
Brian Thomas Jr. was a less exciting play this past week, only garnering three actual targets and a very low 1.9 Predicted Targets.
Will Dissly ended up getting six actual targets, his third-highest target total on the year!
Zach Ertz received a solid six actual targets but had his season high in Predicted Targets at 6.7.
Chuba Hubbard finished with six actual targets, his second-highest total on the year!
Season Leaders in Share of Predicted Targets Through Week 10
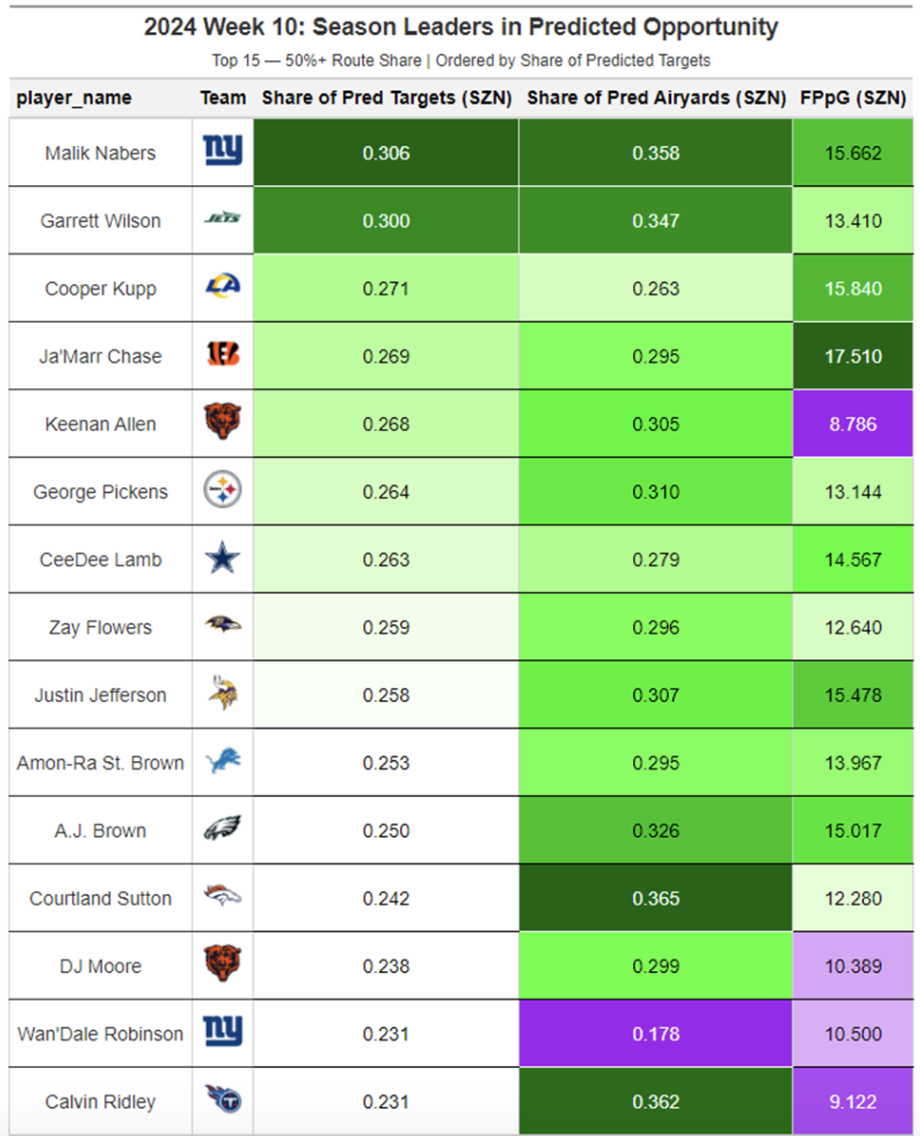
Two Bears receivers show up in our season leaders. In this article, I want to explore why and see what’s going on with Williams.
We were high on Calvin Ridley weeks before his recent emergence! And now, he is in the top 15 leaders for Share of Predicted Targets on the season.
Zay Flowers continues his WR1 performance in relation to our model, even without having any true production in Week 10.
Week 11 Coach, I Was Open Table
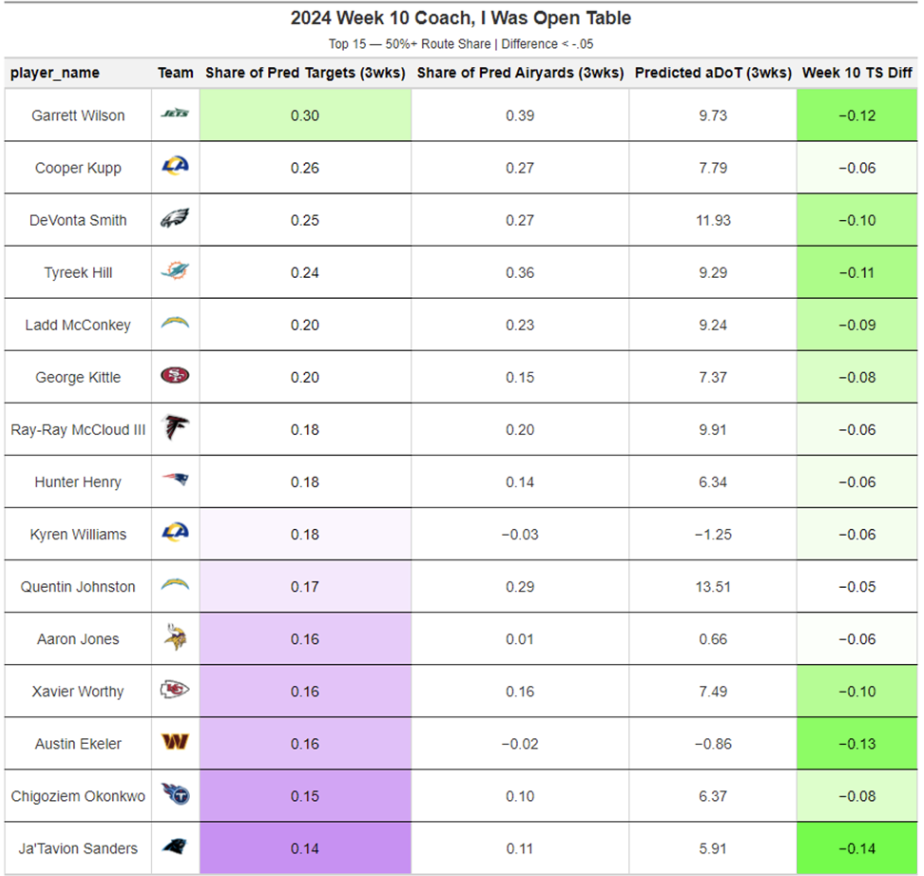
These players recorded a “share of predicted targets” at least 0.05 higher than their actual target share. The idea is that these players have the strongest case to request more targets in Week 11. For example, Garrett Wilson had 12% more Share of Predicted Targets than he did Actual Target Share while having a very solid 3-Week Share of Predicted Targets (.30).
Wilson has a solid matchup this week in playing the Colts, who rank seventh in Middle of the Field Closed (MOFC) coverage on the season, but 16th over the past month. MOFC generally allows for truly elite WR performances. Also, over the last month, the Colts also have a bottom-10 coverage unit per PFF team grades.
Cooper Kupp draws a great single-coverage matchup against the Patriots, who have allowed the fifth-most single-coverage opportunities in the NFL on the season.
DeVonta Smith also faces a terrific single-coverage matchup on Thursday against the Commanders, who have allowed the eighth-most single coverage opportunities on the season. However, A.J. Brown generally dominates those situations for the Eagles, increasing his target share by a whopping 20%. Smith should still get some opportunities to shine, and potentially more targets than normal.
Bears Passing Woes
As I have discussed before, Caleb Williams is struggling.
Williams has:
- The 34th PFF passing grade in the NFL on the season for QBs with at least 100 dropbacks
- A 2.5% big-time throw rate, which ranks 30th
- A 72.3% adjusted completion percentage, ranking 32nd
- The eighth-highest average time to throw (3.03)
- The fourth-worst pressure to sack % (29.5%)
Which is all pretty rough, but the big question is: what’s going on with the rest of the offense to help or hurt him?
- The Bears have the 10th-best PFF pass-blocking team grade on the season
- The Bears also have the fifth-worst PFF team receiving grade on the season
Looking at just the Week 10 predicted targets model:
- Williams threw it to a player with less than a 50% target probability 14 out of 30 times
- Williams didn’t throw it to a player with above a 50% target probability six times
I want to examine a few of these attempts:
Keenan Allen had a target probability of 67% on this play
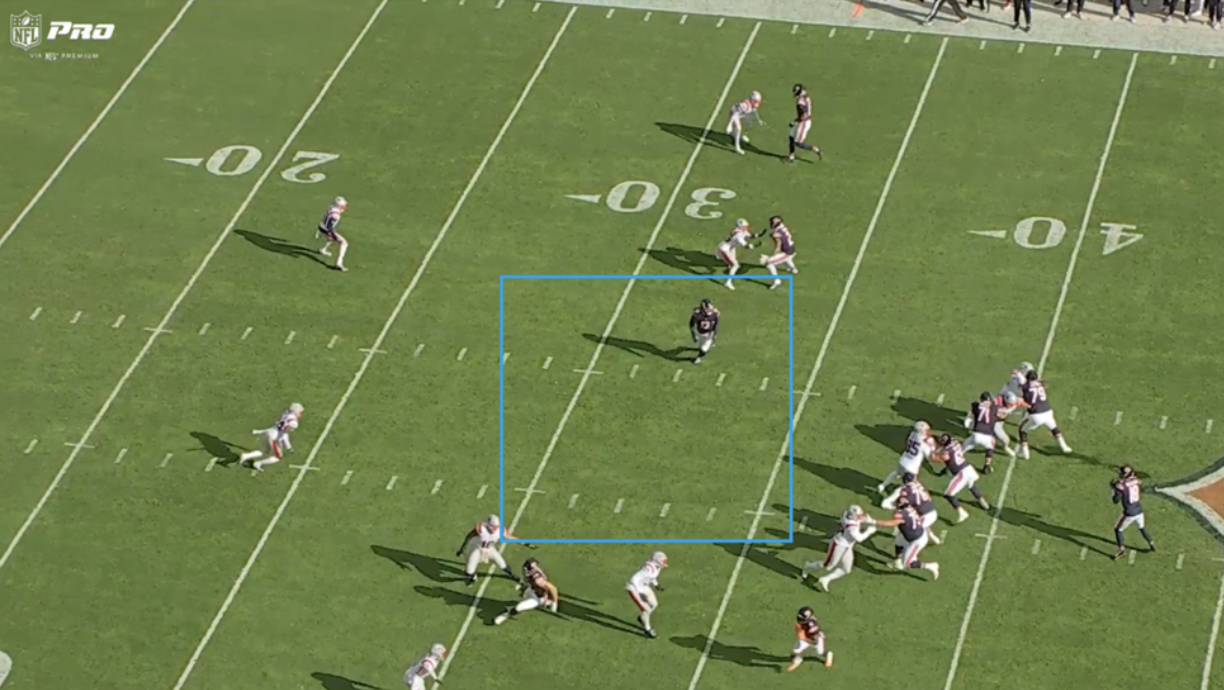
This is a great example of why Allen is a leader in Share of Predicted targets but has not realized his potential. Of the six attempts in which Williams did not make a passer to a player with a target probability above 50%, Allen was on the end of four of them. It’s important to note that Williams did scramble for five yards here on fourth-and-4, but it could have been so much simpler and less risky had he just thrown the ball to Allen.
Not all Williams’ fault
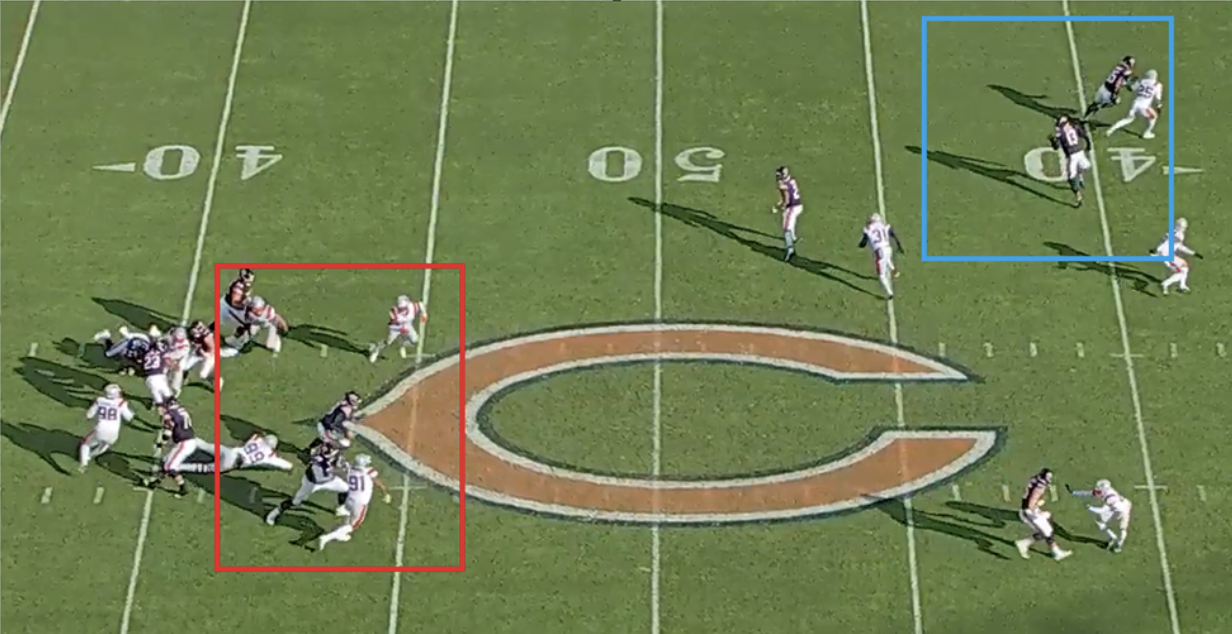
Here is a good example of a play where Allen was wide open, but the Patriots blitzed heavily and protection subsequently broke down. I would not lay blame on Williams for this, but he also failed to create given this opportunity and instead got tackled for no gain or loss.
D.J. Moore had a 50% target probability on this play
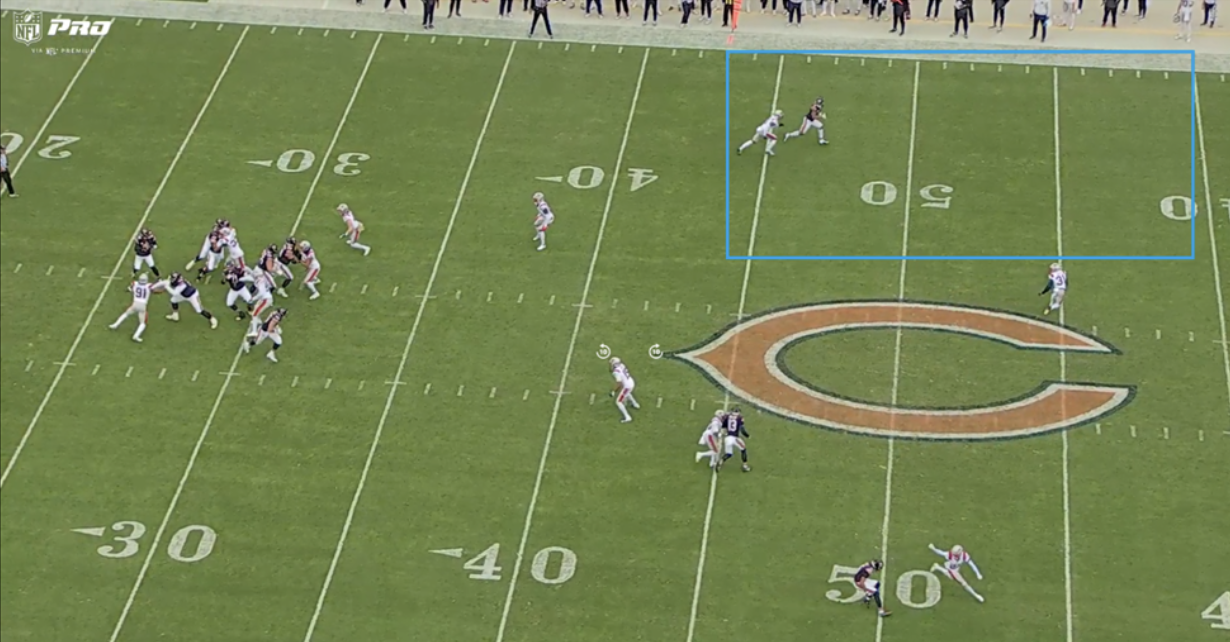
In the NFL, this is open. Moore beats his man quickly at the line before pressure legitimately reaches Williams. Many seasoned QBs would have thrown the ball at this moment toward the boundary, but Williams ended up taking a nine-yard sack on this play instead. This is not an easy throw by any means, but definitely a throw the first overall pick is expected to make.
All in all, the talk around Williams’ struggles often involves some level of blame on either the O-line or ex-OC Shane Waldron. But, there has to be some level of accountability for Williams himself simply underperforming relative to expectation.
One of the big concerns with Williams coming out of college was his time to throw being very high (2023: 3.16 seconds; 2022: 3.24 seconds), and Williams has allowed his NFL time to throw to creep up. Over his last five games, he has posted four games with an average time to throw above 3 seconds. The league average is around 2.8 seconds, and those .23 seconds matter.
Thank you for reading this article. You can follow me on Twitter/ here.


 © 2024 PFF - all rights reserved.