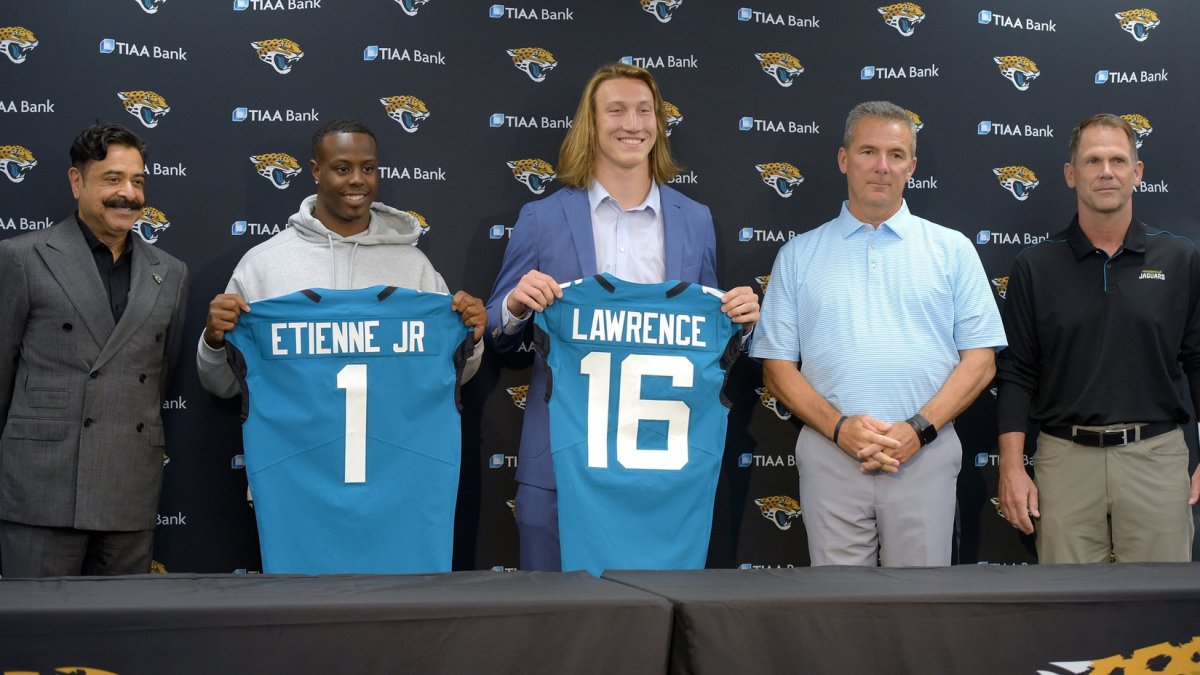
A total of 259 players were selected to join the NFL as a part of the 2021 NFL Draft, from Clemson QB Trevor Lawrence at No. 1 overall to Houston LB Grant Stuard at No. 259. And as experts analyzed the picks and the draft grades hit the presses, a commonly conveyed postscript was that each team got a little bit better.
Relatively speaking, that’s not entirely true, because in a league with 32 teams, we expect 16 teams to get better and 16 teams to get worse. So, fans of those allegedly improved teams might be questioning whether these reports are accurate and what it means for their team going forward if these reports do hold true.
We want to answer these questions in this article, so we'll start by assuming that we already know which teams drafted valuable players and which teams did not.
As usual, we measure draft success by comparing the draft prospects who outperformed their draft position, and we can do that in two ways. We can either compute the PFF WAR above expectation for each prospect and thus for each team's draft class, or we can look at the average percentile the drafted players of a team land in when we compare them to their estimated distribution of outcomes based on draft selection and position.
The first method is more determined by outliers, either quarterbacks or elite players from valuable positions such as Michael Thomas at wide receiver. The second method measures the consistency and compares a player only against his peers at the same position.
Subscribe to
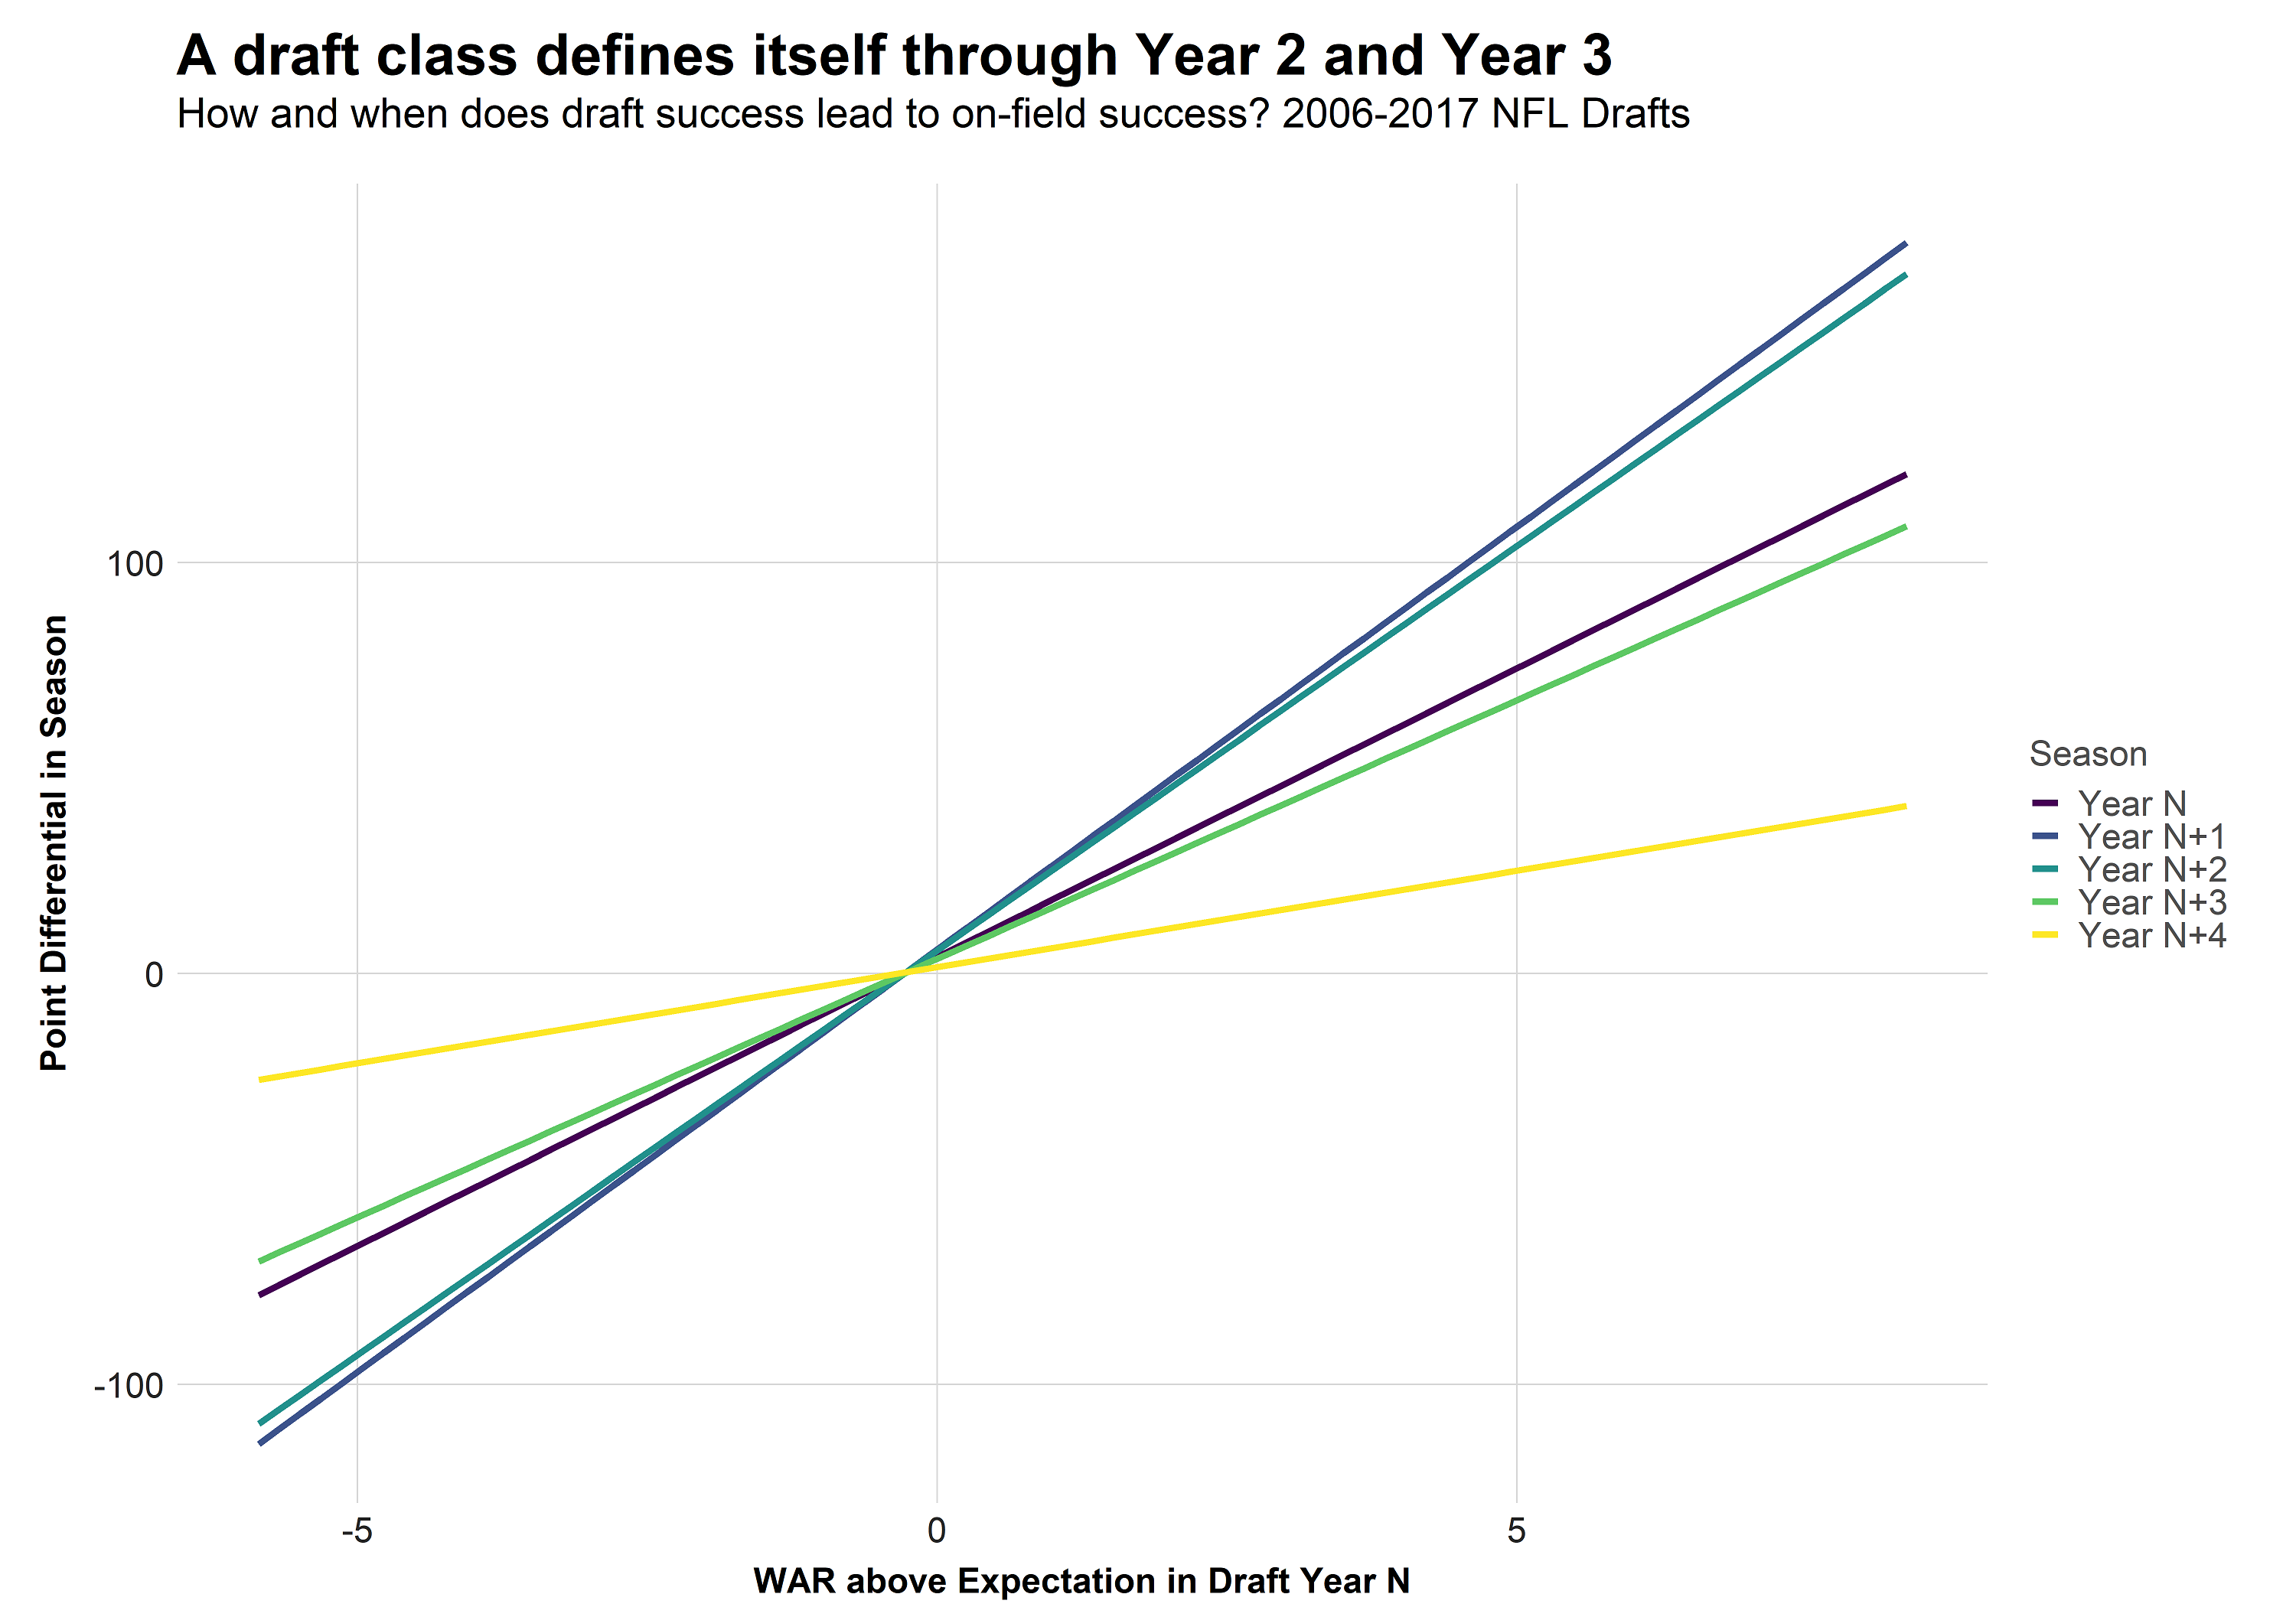
The following chart shows how WAR above expectation generated by the draft selections in Year N leads to more team success in the following years.

We notice that a strong correlation is found in the second and third year for the draft class (correlation coefficient of 0.31 and 0.30, respectively), while the correlation is lower in the first and fourth year (0.21 and 0.19, respectively). The positive correlation is almost non-existent in the fifth year (0.07).
The effect of the draft class is mitigated in Year 1, a reasonably intuitive finding, as we have already found that rookies are generally producing less value and their play isn’t as predictive for the future. However, why would Year 4 have a weaker correlation than Year 2 and Year 3? After all, these players are still on their rookie contract, so teams will usually still have their good draft picks on a cost-controlled salary.
However, we have to note that the correlation measures both ways: Does a good draft lead to good results on the field, and does a bad draft lead to bad results on the field?
The latter is where the correlation becomes visibly weaker: Draft prospects who don't pan out struggle to see the field, and a bad draft class four years ago might have led to high picks in the meantime. By regression to the mean, these picks often turn into better pro players, mitigating the effect of a bad draft four years ago.
The correlation is mostly gone by Year 5 (the yellow line) because the bad draft picks are already forgotten (few were forced to remember the Tampa Bay Buccaneers‘ horrific 2016 draft class during the team's Super Bowl-winning 2020 campaign), and even the good draft picks might already be gone or signed to a deal with a market-based salary. Five or more years later, the positive effect of a good or even historic draft class is mostly gone, and all that’s left might be a quarterback trying to carry a team (looking at you, 2012 Seattle Seahawks draft class).
The following chart shows basically the same information; it just measures draft success by consistency, as explained above. The overall findings are exactly the same, but the correlation becomes a bit weaker (0.29 and 0.27 in Year 2 and Year 3, respectively). This makes sense because we threw away the information about positional value, especially at the quarterback position.


 © 2024 PFF - all rights reserved.