• Calvin Ridley and Ja’Lynn Polk stand out as super regression candidates if their quarterbacks can get them the ball.
• With a new QB, Amari Cooper could be in for a big positive regression day. Based on his routes and usage, he needs it.
• Unlock your edge with a PFF+ subscription: Get full access to all our in-season fantasy tools, including weekly rankings, WR/CB matchup charts, weekly projections, the Start-Sit Optimizer and more. Sign up now!
Estimated reading time: 8 minutes

Fantasy and DFS enthusiasts, bettors, and analysts often rely on a wide array of statistics and models to gain a competitive edge. These range from basic box score stats to advanced metrics available in PFF's Premium Stats 2.0 and models like Josh Hermsmeyer‘s Buy Low model and WOPR (Weighted Opportunity Rating).
There is always room for new insights and analyses to help bettors and fantasy managers refine their strategies. That’s why I have developed a new metric that offers several advantages over WOPR.
For the uninitiated, WOPR — calculated as (1.5 * Target Share) + (0.7 * Air Yards Share) is widely regarded as one of the most effective and predictive opportunity metrics in fantasy football.
In my approach, I utilized a Predicted Targets Model alongside a Predicted Air Yards Model to create advanced route-level receiving metrics. In this article, I will build upon the concepts from my Week 5 “Coach, I Was Open!” article and introduce a Predicted WOPR that incorporates my Share of Predicted Targets and Share of Predicted Air Yards variables from Week 6.
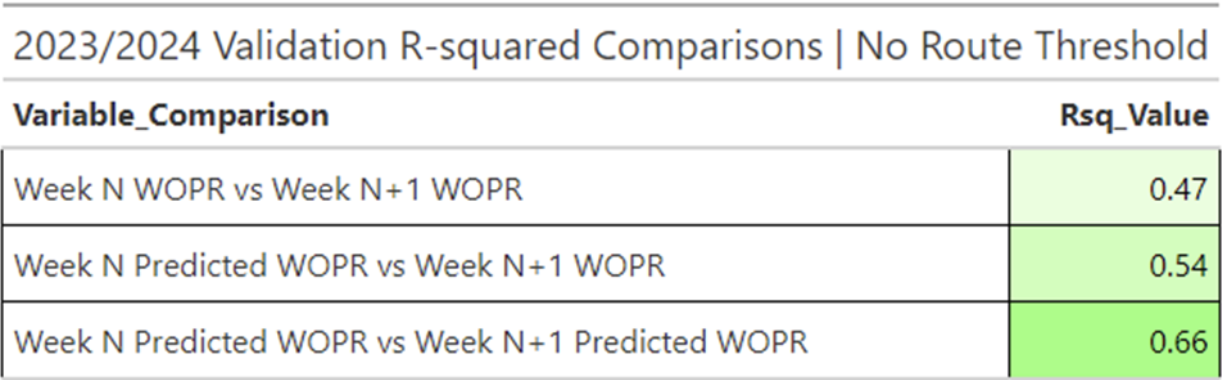
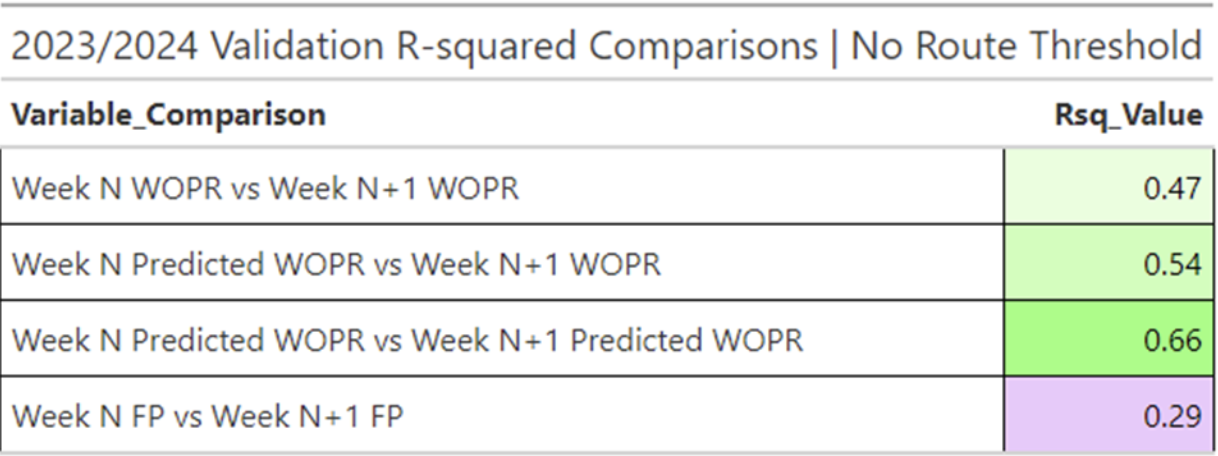
Before diving into the details, I’d like readers to know that Predicted WOPR has the potential to outperform Actual WOPR when it comes to predicting future outcomes. WOPR is widely regarded as one of the most stable metrics in mainstream fantasy usage, with a .47 R-squared (Rsq) when predicting N+1 WOPR for the 2023 season without any route threshold. In comparison, Predicted WOPR achieves a .66 Rsq for predicting N+1 Predicted WOPR during the same season. This indicates a notable improvement in stability, with a .19 raw Rsq stability enhancement over the most recognized receiving metric available.
Additionally, Predicted WOPR appears to be more effective at forecasting Next Week's WOPR than Actual WOPR.
If you care about advanced fantasy football analysis, DFS or tail events, this article is for you.
Regression to the Mean
Regression to the mean is a fundamental statistical concept that plays a critical role in predicting future performance, especially in the context of sports analytics. It refers to the tendency for extreme or outlier performances to move closer to the average (or mean) when measured over time.
In fantasy football, this means that players who perform exceptionally well or poorly in a given week are likely to have their future performances revert to more typical levels.
For example, if a receiver has an unusually high target or air-yards share in one week, their performance will likely regress in subsequent weeks, approaching their usual level. This is not to say that standout performances can’t occur, but rather that outliers are often influenced by random factors that aren’t sustainable week to week, such as game script, defensive matchups or even sheer luck.
In the context of WOPR, regression to the mean is an essential principle because opportunity — or predicted opportunity in the case of my model — is inherently more stable than fantasy points (FP). While FP can fluctuate wildly based on touchdowns or big plays that may not consistently occur, WOPR measures the player's opportunity on the field, which tends to remain more consistent over time.
Because WOPR is stable, we can use it to identify situations where a player’s opportunity remains high but their fantasy points are low due to short-term variance or bad luck.
This is where regression to the mean works in our favor: When we see a stable WOPR but low FP, it often signals an upcoming “explosion” game, where a player’s FP will likely catch up to the underlying opportunity they’ve been getting. This gives us a predictive edge, allowing us to anticipate breakout performances before they happen.
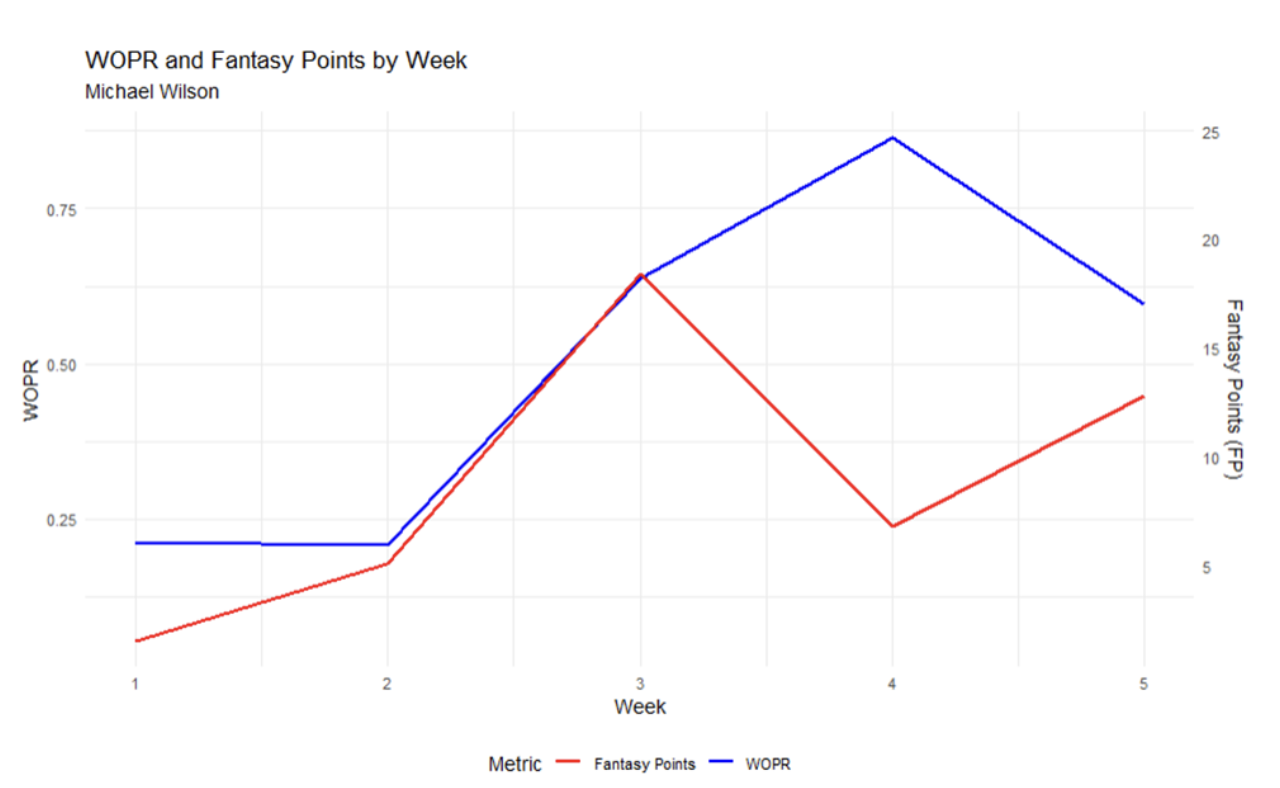
Here is a good example of some regression to the mean for Michael Wilson.
In the graph, Actual WOPR is represented in blue, while Fantasy Points (FP) are shown in red. In Week 4, we see Wilson’s Actual WOPR spike to an impressive .86, but he didn’t capitalize on that opportunity, finishing with only 6.8 fantasy points. Although his WOPR remained strong, it decreased to .59 the following week, yet he scored more Fantasy Points (12.8).
We can leverage this effect to our advantage and model it accordingly.
Predicted WOPR serves as a better predictor of Actual WOPR than Actual WOPR itself. Additionally, it is more stable, making it an ideal candidate for creating a simple Residual Model.
Modeling Predicted WOPR Residuals
To create Predicted WOPR, we developed some complex models, as explained in my previous articles. However, the model we will use for predicting fantasy points will be significantly less complex yet still effective. We only need a simple linear regression. We aim to predict the three-week average fantasy points using the 3-week Predicted WOPR and then analyze the residuals.
Here is the regression output for Actual WOPR.
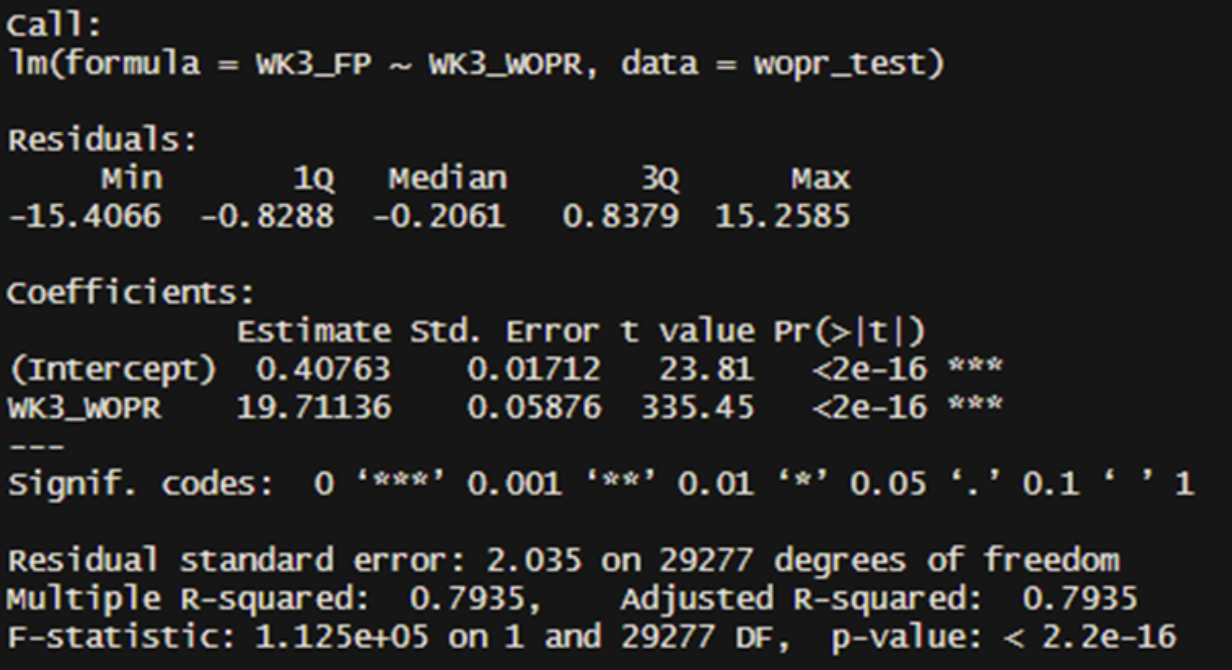
We can see that our R-squared (Rsq) for predicting three-week fantasy points (per game) using three-week Actual WOPR is .79. This means that we can explain 79% of the variance in three-week fantasy points per game based on three-week Actual WOPR.
That’s a substantial amount of variance explanation! This demonstrates that Actual WOPR effectively captures what has occurred over the past three weeks. However, it’s important to note that we are not yet predicting future outcomes.
Here is our regression output for three-week Predicted WOPR.
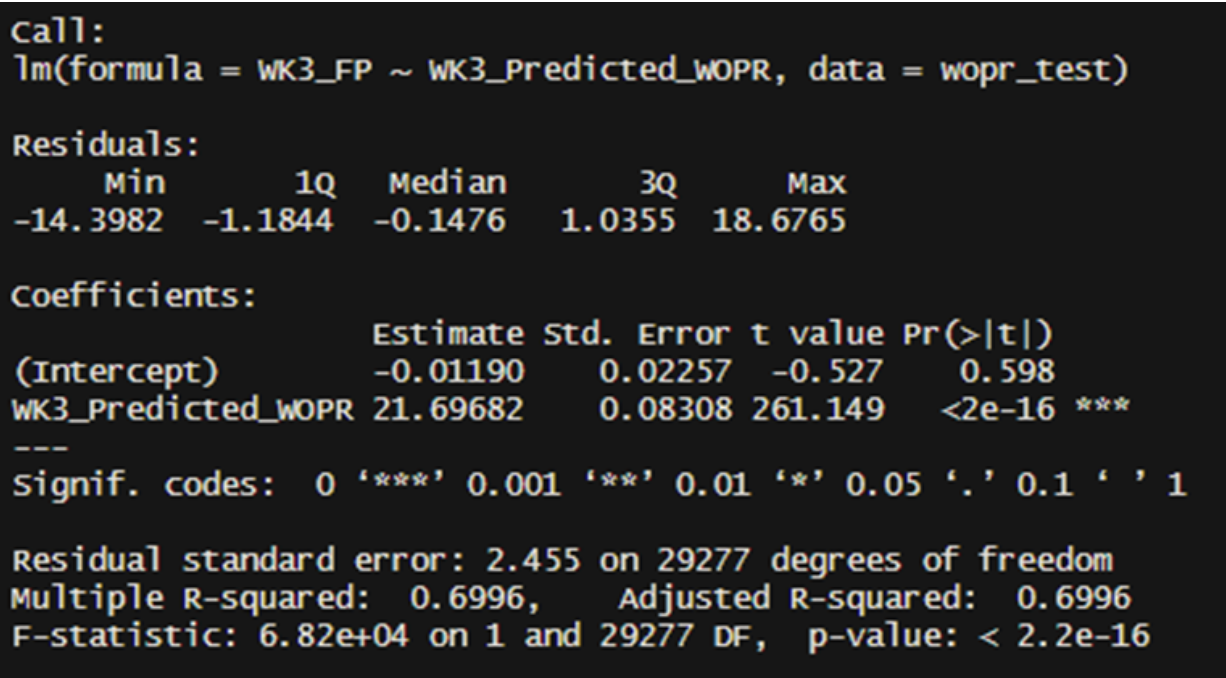
In the same context, our R-squared (Rsq) for three-week Predicted WOPR is .70, which is lower than that of three-week Actual WOPR.
This is understandable, as Actual WOPR reflects the opportunities that actually occurred, while fantasy points per game indicates the yield from those opportunities. Remember, we are not yet predicting future outcomes.
What ultimately matters is how the residuals predict future fantasy points. This is how we gain an edge in fantasy, DFS, or any other analysis we undertake.
A residual represents the “error” from a model, or in other words, the variance that we cannot explain. Every prediction carries some level of error. For example, if we predict Zay Flowers to receive 10 targets, but he only gets five, our residual would be -5. Conversely, if we predict A.J. Brown to receive 12 targets, but he gets 15, our residual would be 3.
This residual can serve as a powerful predictor for other models and variables when used effectively.
To effectively use this in Fantasy/DFS, we want to analyze the residuals from our three-week Actual WOPR model and three-week Predicted WOPR model to see how those residuals predict future outcomes (next week). One important aspect we need to ensure for our residual models is that we account for individual player performance in some manner.
Instead of simply predicting “Next Week Fantasy Points,” I aim to predict “Next Week Fantasy Points – 3-Week FPpG.” This approach standardizes our response variable and helps us identify true “BOOM” performances, as it takes into account each player’s recent expectations.
For instance, consider Justin Jefferson, who is averaging 17 fantasy points per game (FPpG). If we predict him to score 19 FP next week, that would likely represent a high percentile prediction in our model. However, for Jefferson, it wouldn’t be a significant increase relative to his average.
Instead, we want to predict the difference between future and past averages. In this scenario, if we predict Jefferson to have a modest increase of 2 FP over his average, this would indicate a solid prediction since he’s only scoring two FP more than his average. This method allows us to better account for individual players’ skills and situations. The main goal of this approach is to demonstrate that residuals can effectively help us predict outlier performances for players.
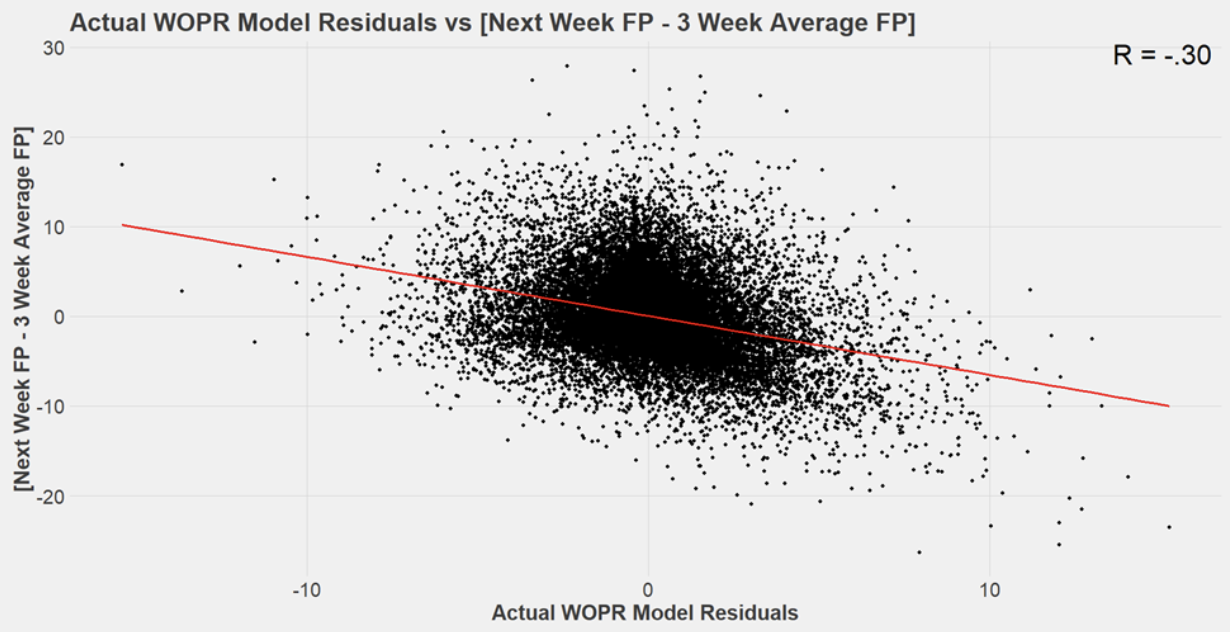
The graph above illustrates the residuals from our Actual WOPR model, showing a correlation of -0.3 with [Next Week FP – 3-Week FPpG]. This is a solid indicator that our approach is effective for Actual WOPR.
More specifically, it reveals that players with a negative residual tend to outperform their expectations more frequently than those with positive residuals (regression to the mean).
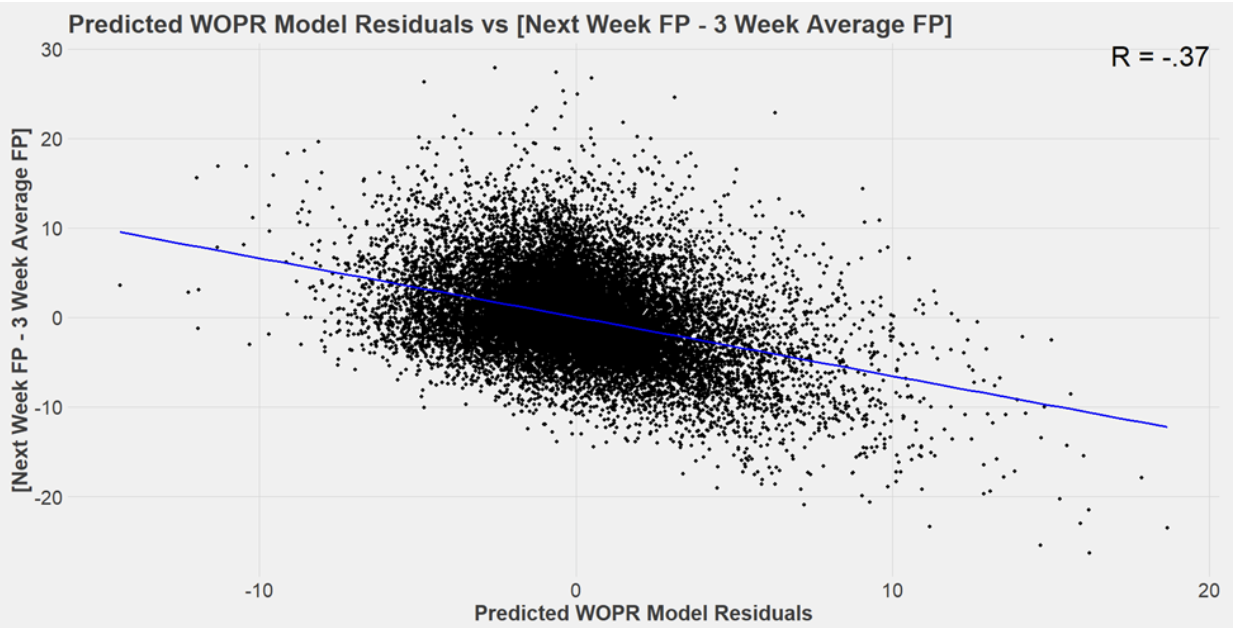
Here are the results for our Predicted WOPR model residuals. As you can see, we improved our Pearson correlation by 0.07! This is promising news for our future fantasy success. This 0.07 improvement in correlation translates to a 0.043 increase in R-squared (Rsq). This means that the residuals from our Predicted WOPR model can explain 4% more variance than the residuals from the Actual WOPR model in [Next Week FP – 3-Week FPpG]. Ultimately, this indicates that our Predicted WOPR residuals outperform the Actual WOPR residuals, widely regarded as the best residual predictors in public usage.
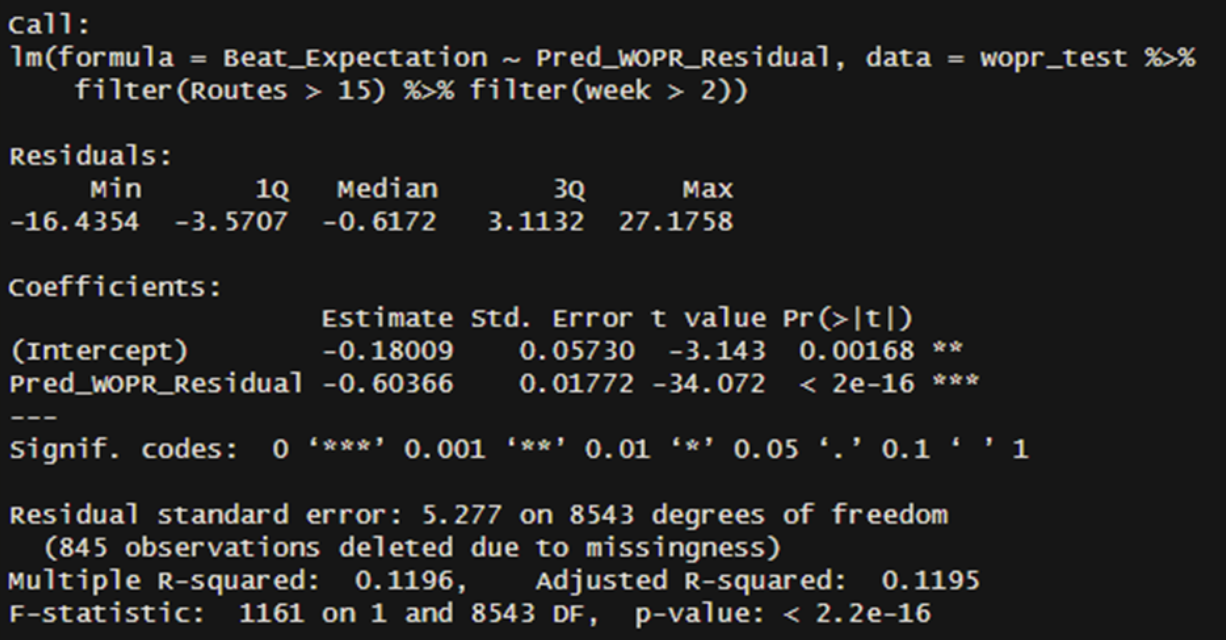
Using only our residuals, we can predict Beat Expectation (Next Week FP – 3-Week FPpG) with an R-squared (Rsq) of 0.12! This is a strong result, especially considering we are removing the three-week average in fantasy points from our response variable. In comparison, the model using Actual WOPR yields an Rsq of 0.08, demonstrating that our Predicted WOPR is superior.
We can utilize this model to project players' performance from the current week into the next.
Week 7 Route-Based Heroes
Players who are sometimes here to save the day!
Route-Based Heroes is a weekly DFS/fantasy article I would like to deploy looking at players with a negative residual in the 3-Week Predicted Fantasy Points Model.
Remember, the residuals had a -.37 correlation to beating each player’s fantasy expectation in a given week. This was better than Actual WOPR.
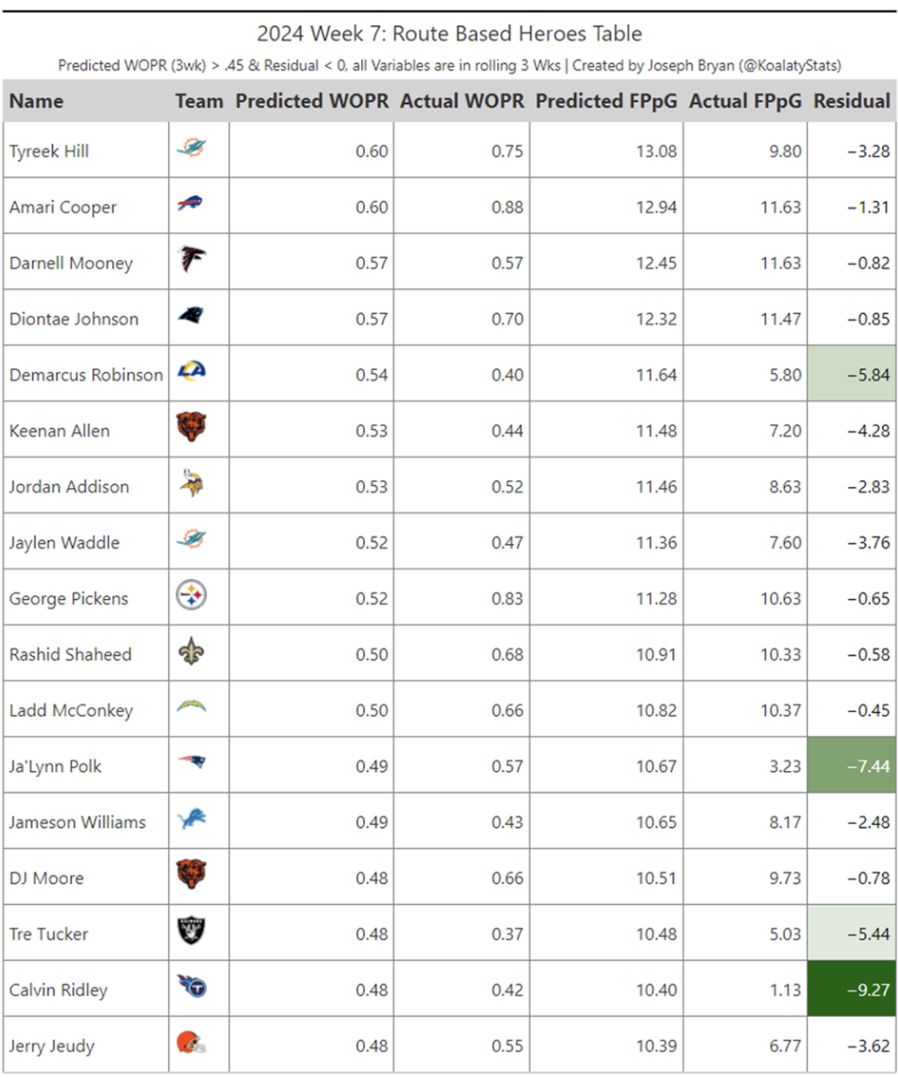
Here is a list of players with a high Predicted WOPR and a model residual less than 0.
Players with a high Predicted WOPR are running valuable routes and consistently getting open. Players with a residual less than 0 need to perform better than expected to regress to their mean.
Think of this list as players who have a higher likelihood than normal of having a boom game.
• Calvin Ridley and Ja’Lynn Polk stand out as super regression candidates if their quarterbacks can get them the ball.
• With a new QB, Amari Cooper could be in for a big positive regression day. Based on his routes and usage, he needs it.
• With Davante Adams out of town, Tre Tucker could see an uptick in usage. He is in need of positive regression.
Any player on this list has the chance at an exceptional performance based on our model and residual predictions.