• Unlock your edge with a PFF+ subscription: Get full access to all our in-season fantasy tools, including weekly rankings, WR/CB matchup charts, weekly projections, the Start-Sit Optimizer and more. Sign up now!
Estimated reading time: 8 minutes
Welcome to the third installment of my statistical modeling series. For those who have not been following along, you can catch up with my initial articles: Introduction to “Coach, I Was Open” and “Refining Coach, I Was Open.”
For today’s article, I wanted to focus on what a predicted target is in a more practical way. What does one look like? What does an entire play look like? Why does a predicted target have a certain probability?
Quick Recap
Before we dive in, let me provide a quick recap. The main takeaway is that by applying machine learning to route-level PFF data, we can predict whether a player should have been targeted, even if they weren’t. This capability is incredibly powerful and allows us to derive numerous valuable statistics.
In my second article, I created two primary metrics: “Share of Predicted Targets” and “Share of Predicted Air Yards.” These metrics provide insights into several important aspects, such as: How do you compare to other receivers on your team? What types of routes are you running relative to your teammates? And how often should you be getting the ball compared to your peers? We achieve this using an XGBOOST model on route-level PFF data, but you can refer to the first article for more details on that process.
Current Season Leaders in Share of Predicted Targets:
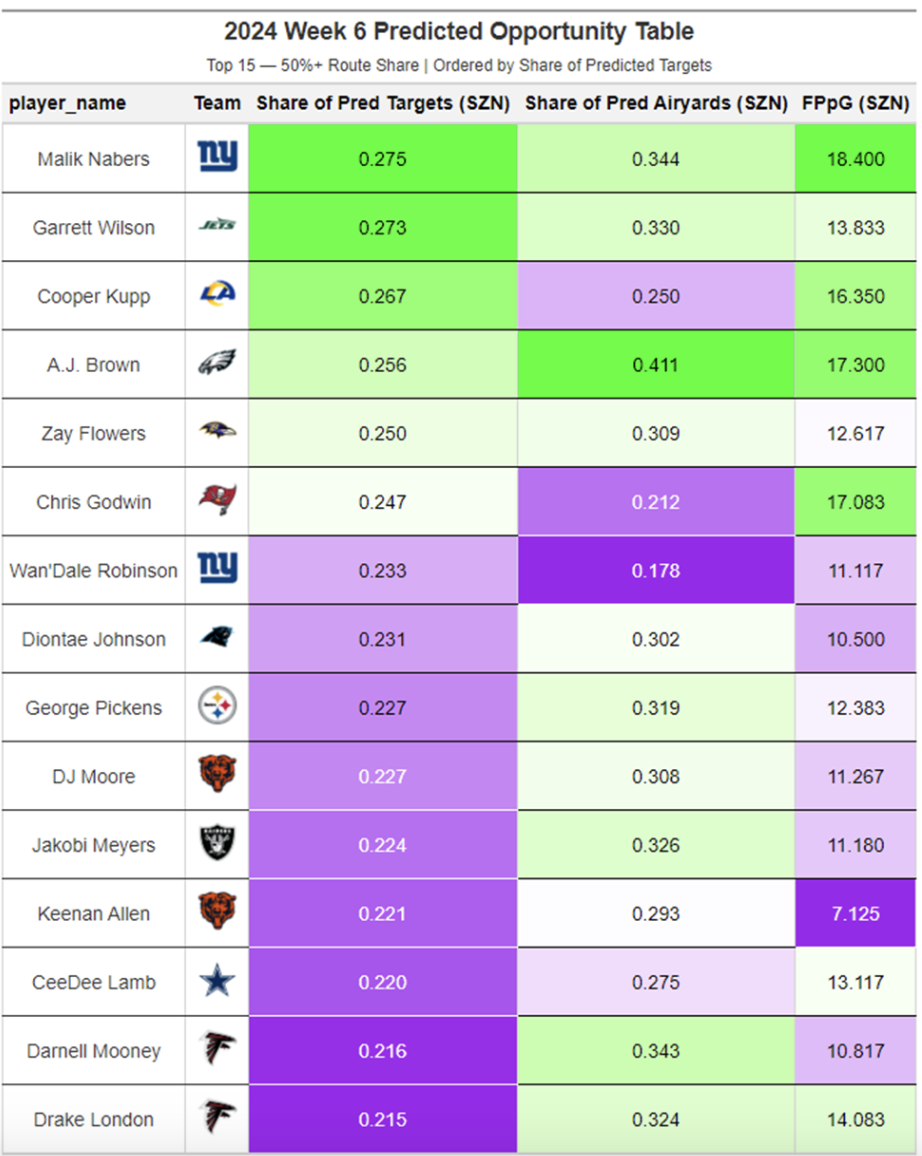
Malik Nabers and Garrett Wilson have been absolutely dominant in terms of their share of predicted targets. That said, it will be interesting to see how the Davante Adams trade affects Wilson's share going forward. It’s something I will be monitoring.
Drake London and Darnell Mooney are being deployed similarly, and Mooney could be poised for more big games later this season. Zay Flowers is proving to be a legitimate threat.
Wan'Dale Robinson‘s numbers are likely inflated due to Nabers being out for a few weeks; however, he is running very low-value routes, as evidenced by his .178 Share of Predicted Air Yards. A.J. Brown has played only a few games so far, but the Eagles are allowing him to dominate downfield, which bodes well for his outlook for the rest of the season.
Following the Adams trade, Jakobi Meyers could become the Geno Smith of wide receivers.
Practical Examples From Week 6
Van Jefferson: Predicted Targets: 3.49, Actual Targets: 0
Let us take a look at his highest-probability play.
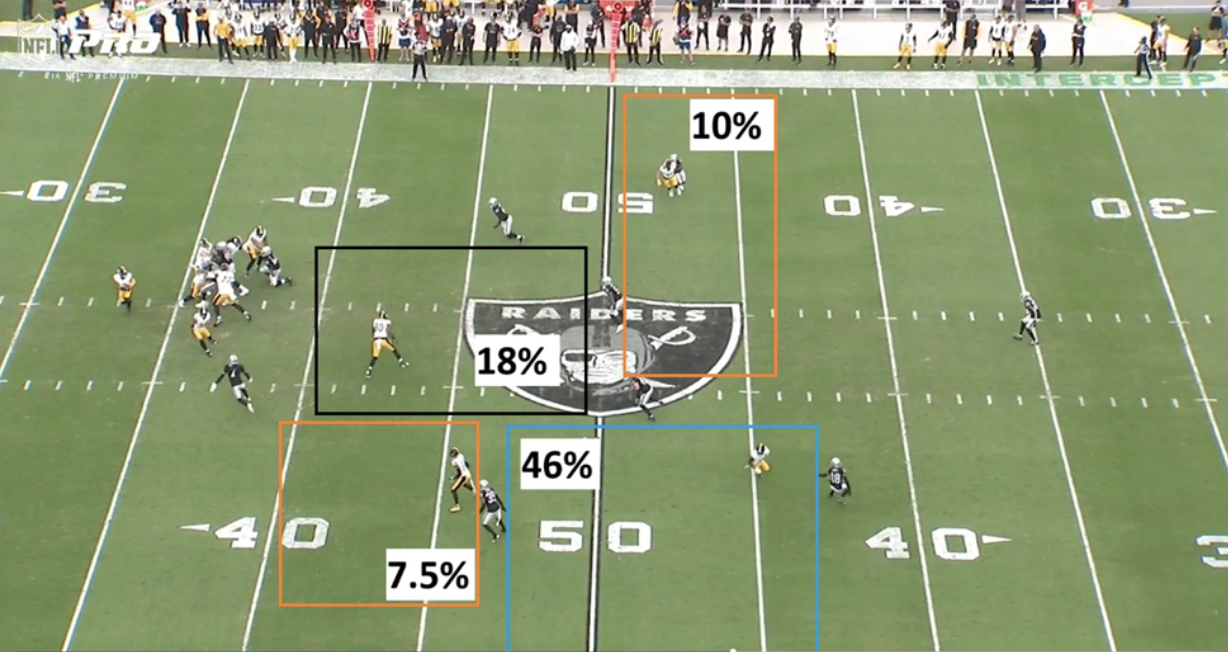
First off, we have a second-and-8 from the 42-yard line. Justin Fields ended up scrambling on the play, and Broderick Jones got called for holding. Fields could have easily thrown the ball to Van Jefferson (46%) or Darnell Washington (18%). George Pickens was open for a pass but would have been met with immediate contact. So, why these probabilities?
- Van Jefferson: 46%
-
- Route Depth = Intermediate (17 yards) on an out route.
- Classified as “open” with good separation.
- A wide receiver on the field with only one other wide receiver (this matters).
- +0.5 PFF grade on the route (anything above 0 is good and will drastically increase the probability of target).
-
- Darnell Washington: 18%
-
- Route Depth = Short (3 yards) on a drag route.
- Classified as “open” with underneath separation.
- A tight end on the field with two wide receivers.
- 0 PFF grade on the route (this is considered expected).
-
- George Pickens and Pat Freiermuth both: <10%
-
- Both are classified as “not open,” with Freiermuth in tight coverage and Pickens with leveraged separation.
- Again, there were only two wide receivers on the play.
- Pickens earned a 0 grade, but Freiermuth was given a -0.5, which drastically decreases a receiver's chance of being targeted in my model.
- Shockingly, Fields didn’t take any option here, and this could be at least one reason we will likely be seeing Russell Wilson in Week 7.
-
Next up: Keenan Allen: Predicted Targets: 7.85, Actual Targets: 6
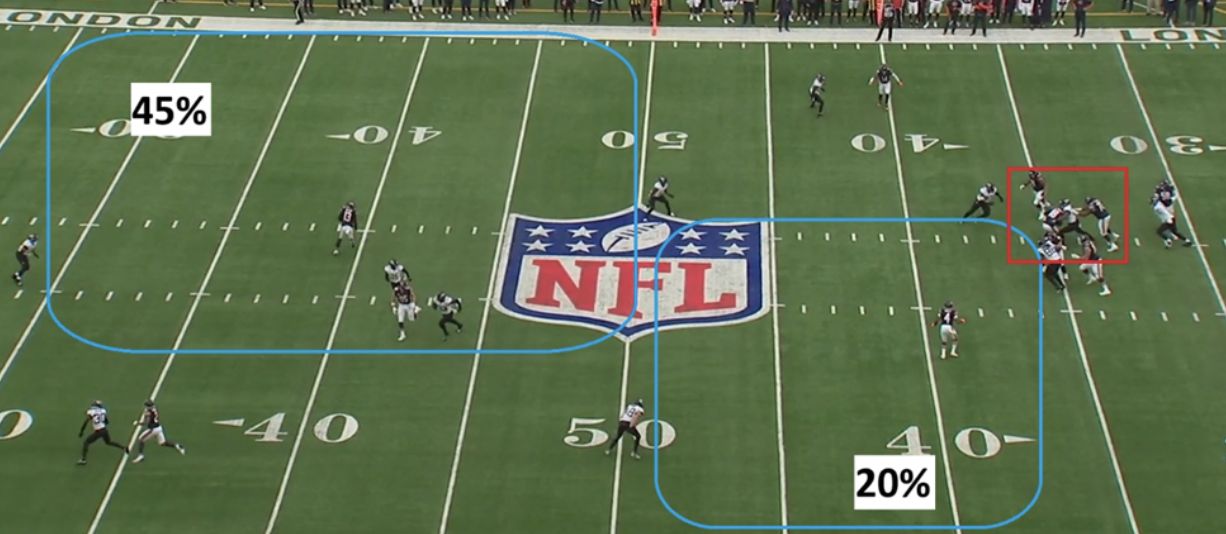
The main broadcast actually pointed out this play in real time as a huge opportunity for the Bears and Keenan Allen. This would have been a massive play if Caleb Williams had had one more millisecond.
The broadcast focused on Allen here, but in my opinion, D’Andre Swift is a bit more interesting (at a 20% target probability). Checking it down after sensing pressure here would allow Williams to simply avoid the sack altogether. This is likely one of the next big progressions he will take in his development. Either way, Williams had a great game, and Bears fans should be very excited.
Sam LaPorta: Predicted Targets: 3.3, Actual Targets: 1
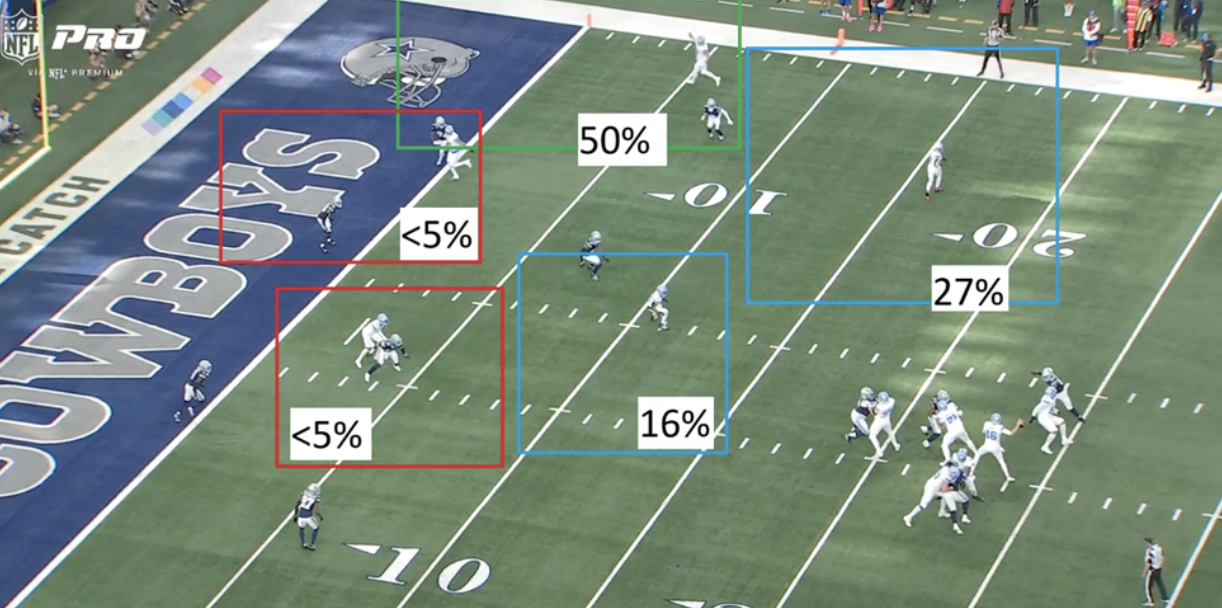
Sam LaPorta fantasy owners, look away. This play resulted in a 6-yard gain by Amon-Ra St. Brown, but it could have been so much more. LaPorta was wide open on this play, with a 50% chance of being targeted for what would have been a touchdown.
The Lions didn’t necessarily need another score, but the optimal play would have been LaPorta. Jahmyr Gibbs would not have been a bad choice either at 27%. I want to break down the probabilities one more time:
- Sam LaPorta: 50%
-
- Go route with three wide receivers on the field (as a tight end). This might actually hurt his probability a little bit.
- Classified as “open” with a separation classification of “Open” (about as good as you can get for this).
- He earned a PFF grade of 0 since all he did was run in a straight line, but that’s all he needed to do.
-
- Jahmyr Gibbs: 27%
-
- Flat route with a low route depth (-3)
- Running back with three wide receivers on the field
- Classified as “Something Else” (these are my generated classifications for missing data). This should likely be classified as “open,” increasing his probability.
- PFF Grade of 0 (neither good nor bad)
-
- Amon-Ra St. Brown: 16% (received the target)
-
- 4-yard sit route with a PFF grade of 0
- Wide receiver on a three-wide-receiver play
- Classified as “Open” with “underneath” separation
-
Week 6 Share of Predicted Targets Table
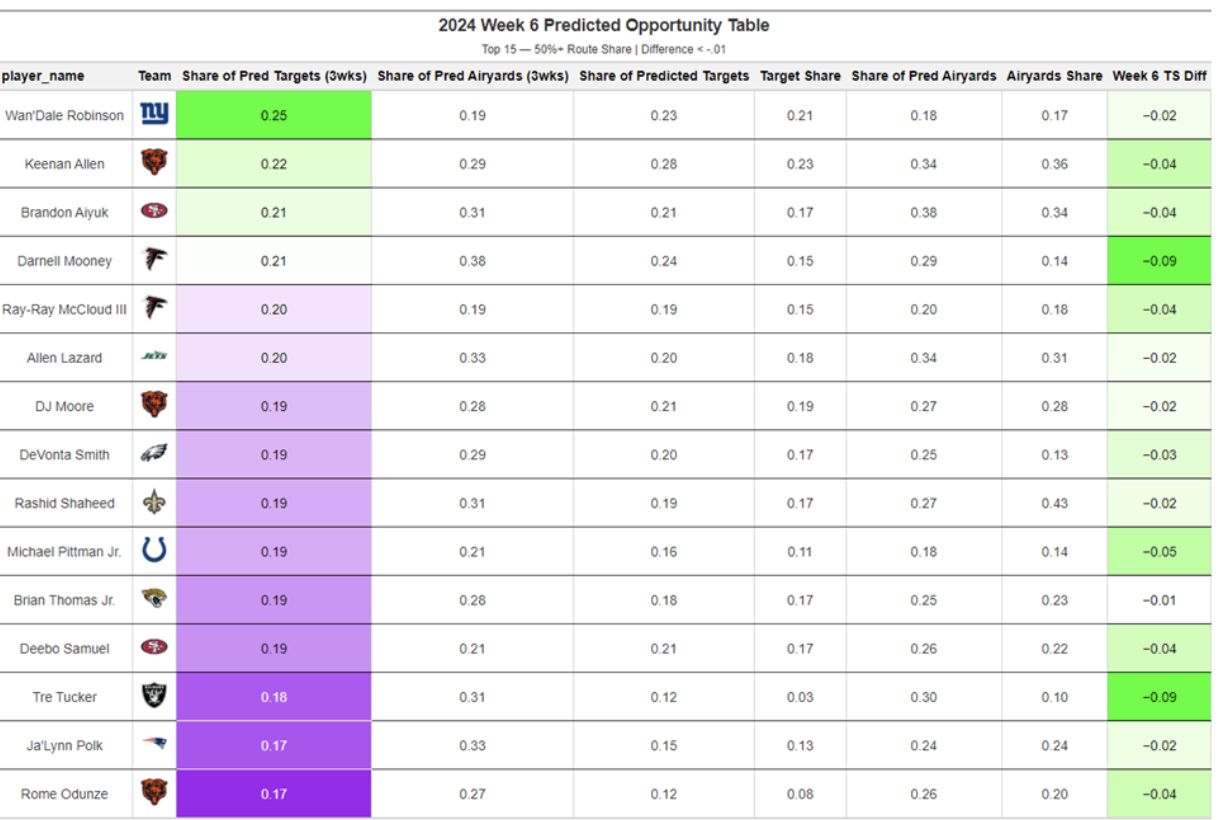
This table showcases the players with the strongest case for telling their coach, “I Was Open!” These players boast the best Share of Predicted Targets and have experienced a negative difference from the most recent week. They are prime candidates to see increased targets in the upcoming week, with Darnell Mooney and Tre Tucker having the largest deficits to make up.
Interestingly, three Bears players appear on this list. It’s understandable for a team like the Falcons to see Mooney and Ray-Ray McCloud III included, as targets are being drawn away by Drake London and potentially Kyle Pitts. However, D.J. Moore and Rome Odunze also make the list —so who is stealing their targets? It turns out that Cole Kmet and Roschon Johnson have been pulling targets away from the Bears’ big three wide receivers. Combined, Kmet and Johnson accounted for approximately 14% more target share than the model predicted.
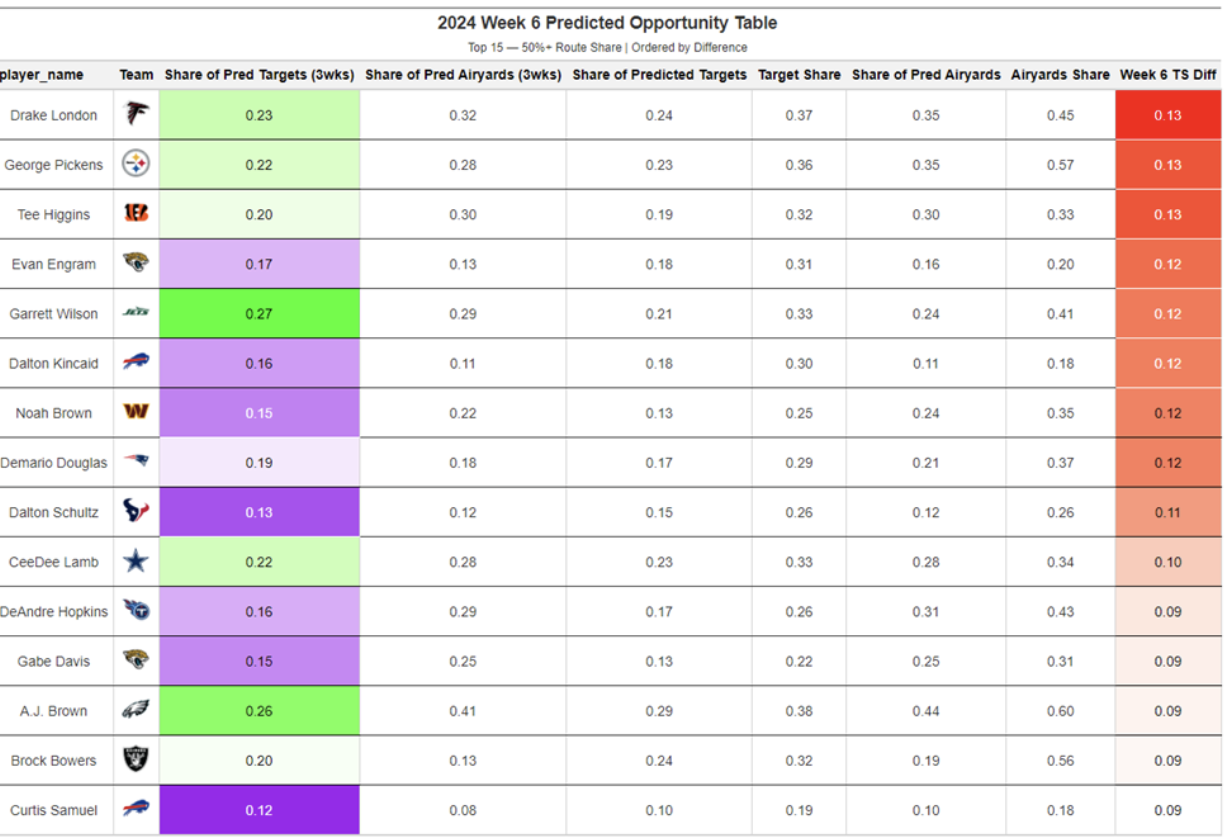
Here is the opposite table: “Coach, I was not open,” if you will. I would like to think of this as “gravity,” in a way. These players simply attracted too many targets relative to their separation in Week 6. Sometimes, this is warranted for truly elite players or players who transcend the game. Other times, the quarterback is just forcing the ball to Dalton Schultz, for instance.
In tracking this table for a few weeks, it also appears that players who didn’t get enough targets in Week N get too many targets in Week N+1. This could be a good thing for fantasy, but maybe not so great for optimal NFL offensive success.
Next week, we will get back into some statistics and improvements! If you would like to follow me for more interesting statistics and models, you can do so on X/Twitter!


 © 2024 PFF - all rights reserved.