When teams discuss selections during the 2022 NFL Draft in Las Vegas, the most important aspect of a decision is, of course, whether they like a given player or not. However, with the rise of evidence-based decision-making in NFL front offices, macro analysis of the draft plays a larger role in the war room of NFL teams and in the media covering the draft. Such an analysis often involves draft pick trades or positional value, but another important aspect is positional scarcity in a given draft class.
When a team selecting in the middle of the first round is hypothetically deciding between Trent McDuffie, cornerback from Washington, or George Karlaftis, edge rusher from Purdue, the endless hours of tape and statistical or athletic profiles might not yield a distinction between the two — and both certainly play valuable positions. To come up with an informed decision, it can be of great help to look at which position you are more likely to fill on Day 2 of the draft. Basically, the opportunity cost of selecting McDuffie would be missing out on a first-round edge rusher, and the opportunity cost of selecting Karlaftis would be missing out on a first-round cornerback. The size of the respective opportunity costs can be measured by the talent (or lack thereof) of the position in the next rounds.
To get an idea how to answer such a question, let's look at the strengths and weaknesses in this year’s draft in terms of the talent at each position.
Click here for more PFF tools:
Draft Guide & Big Board | Mock Draft Simulator
Dynasty Rankings & Projections | Free Agent Rankings | 2022 QB Annual
Player Grades
Overview of positional strength
We investigate positional strength by comparing this year’s big boards to historical allocation of draft capital to each position. Draft capital is measured using our PFF WAR draft value chart, which uses the WAR generated through the first four years by players selected at each draft spot in historic drafts (2006-2018).
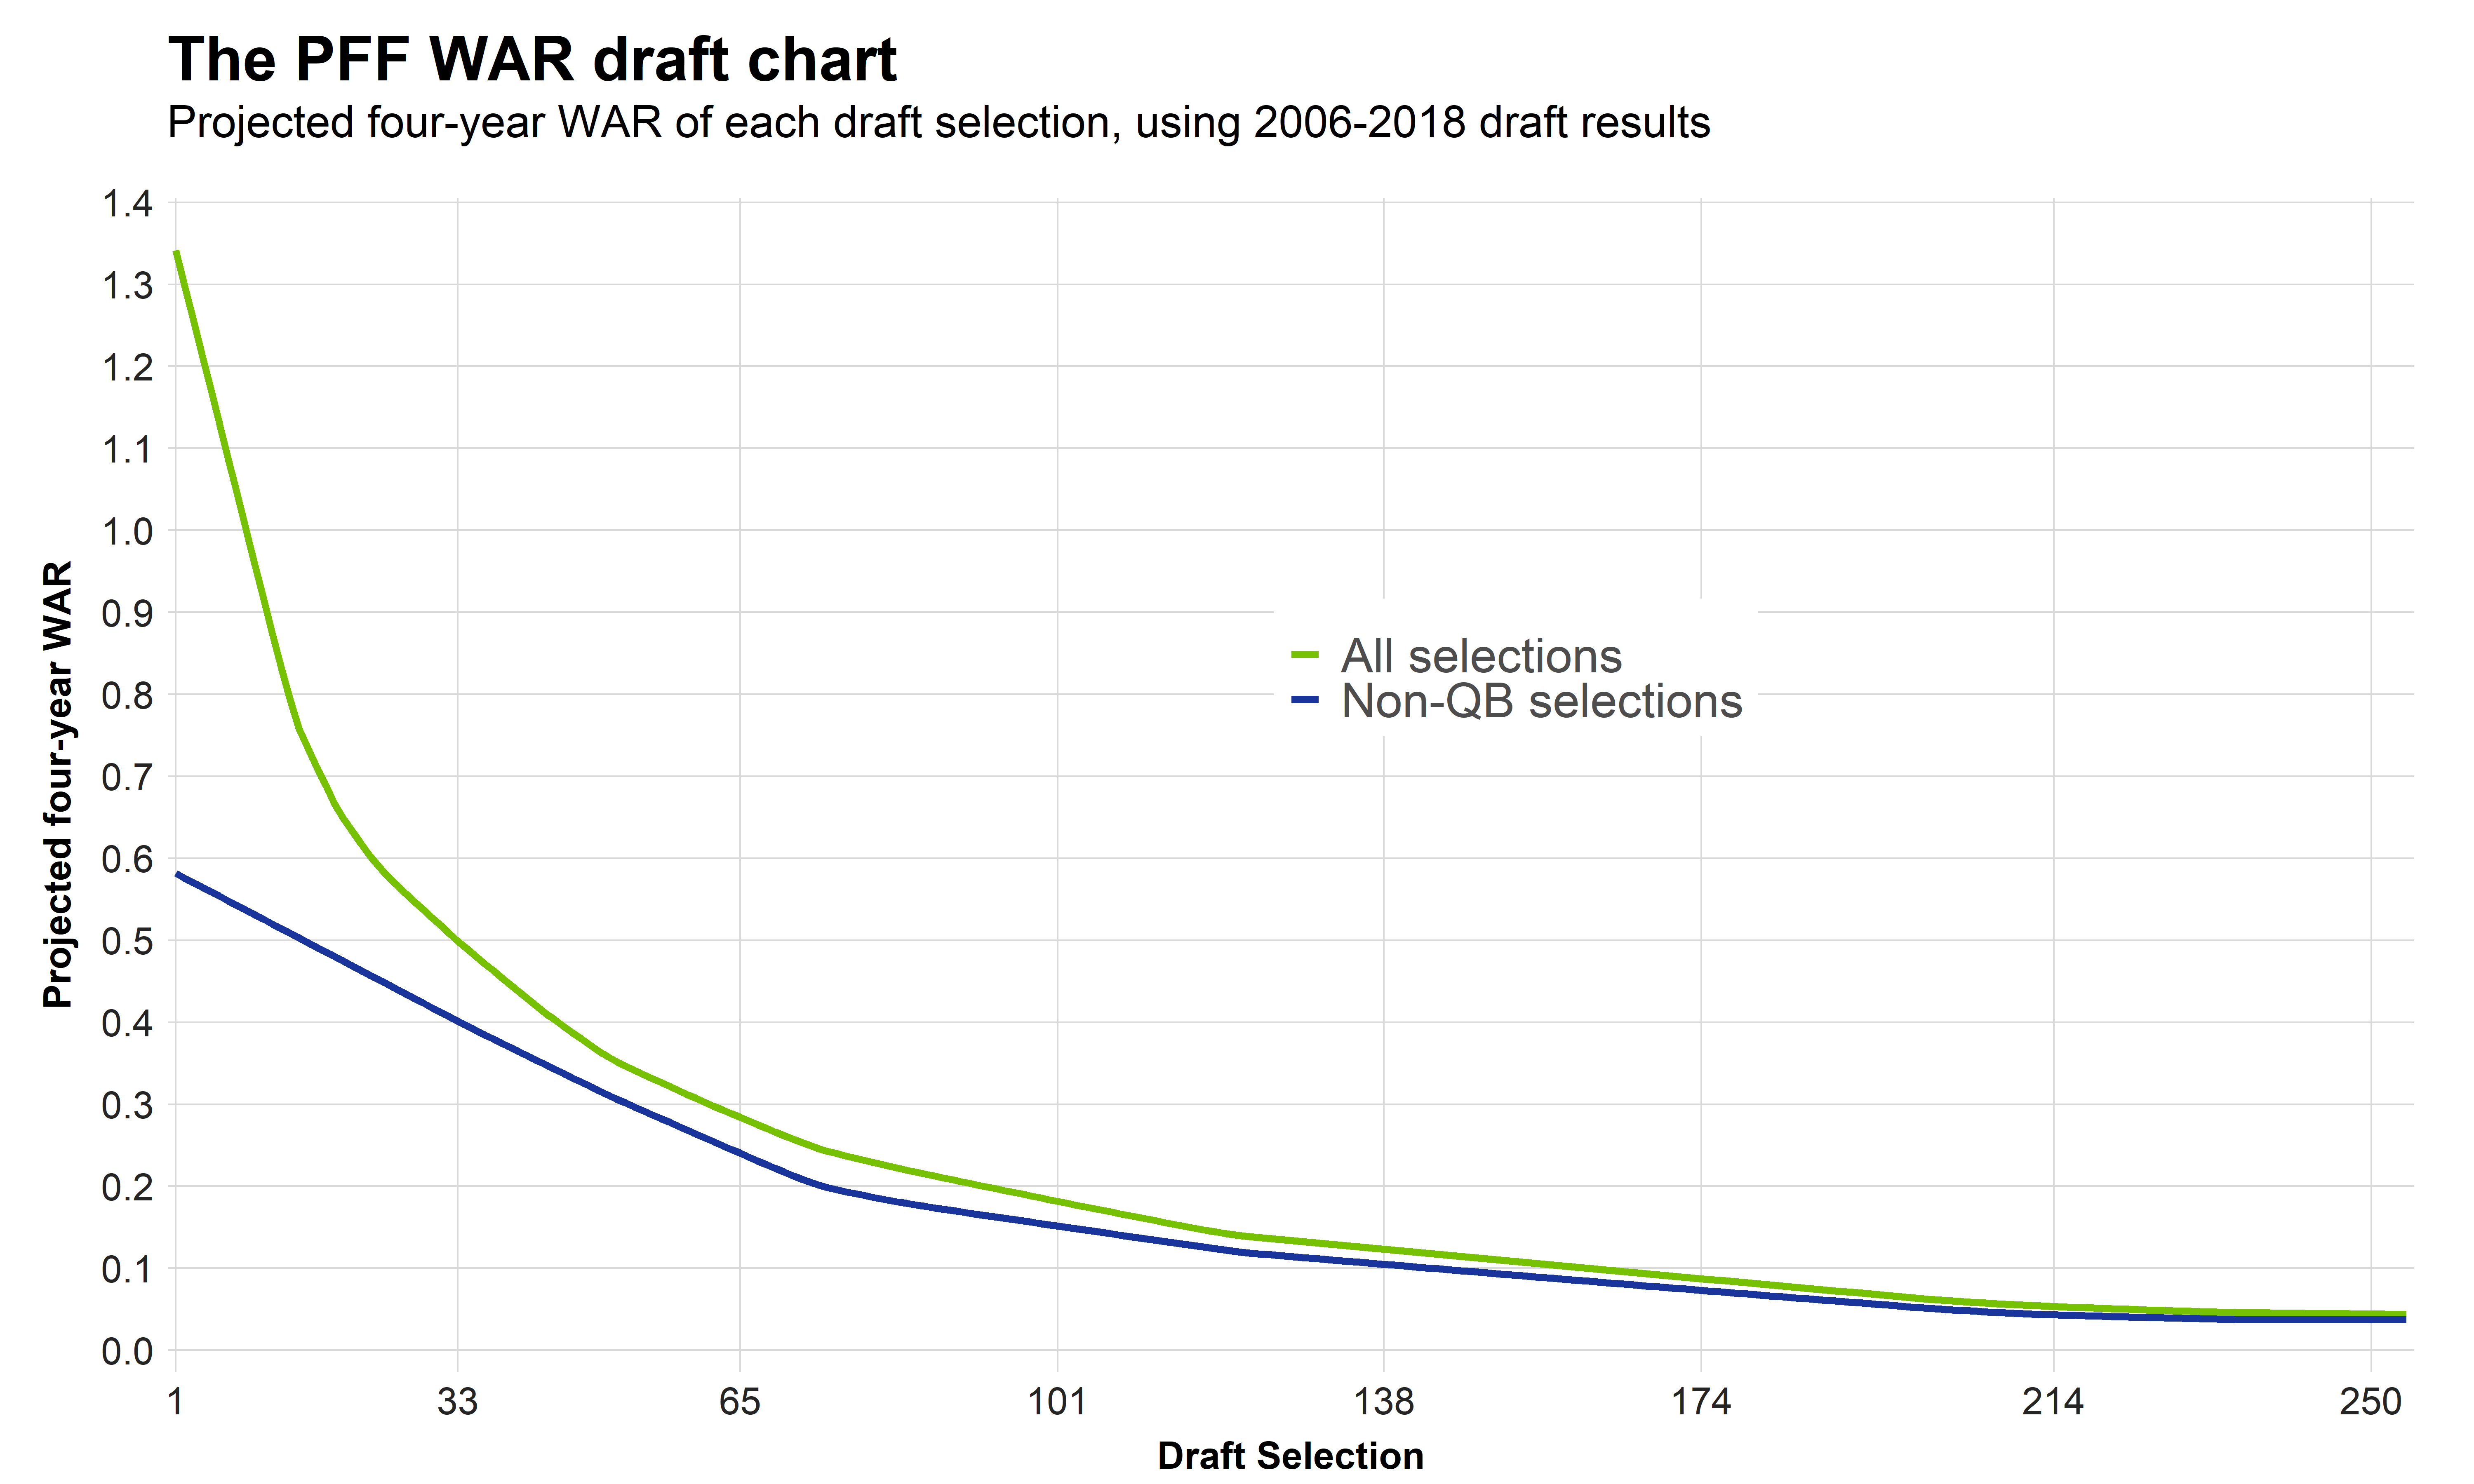
We note that the curve for non-quarterbacks is much flatter than for all picks, but we still use the the curve for all picks to measure draft capital, since the curve for non-quarterbacks, while a realistic glance at the real value of a draft pick used on a non-quarterback, is much flatter than teams think of draft capital. The green curve for all selections is also the draft chart that fuels our draft capital rankings.
To get a first idea of positional strength, we look at the percentage of total draft capital allocated in the NFL Draft from 2015 through 2021 and compare to the allocation of draft capital as suggested by the PFF Big Board as well as the board compiled by Benjamin Robinson from grindingthemocks.com, referred to as the public big board. This is a board based on mock drafts across the industry.
Basically, we will assume that the draft unfolds exactly like the boards suggest and use this to project the draft capital allocation in the 2022 NFL draft and compare it to the historical allocation. A study from last year suggests that this is a reasonable way to project the strength of each position in the draft. We could go further back than 2015 for the historical allocation, but there are recent trends that the NFL considers some positions more or less valuable than a decade ago. In order to avoid comparing the 2022 draft to outdated beliefs, we only look at the seven most recent drafts.
Here are the results for offensive positions.
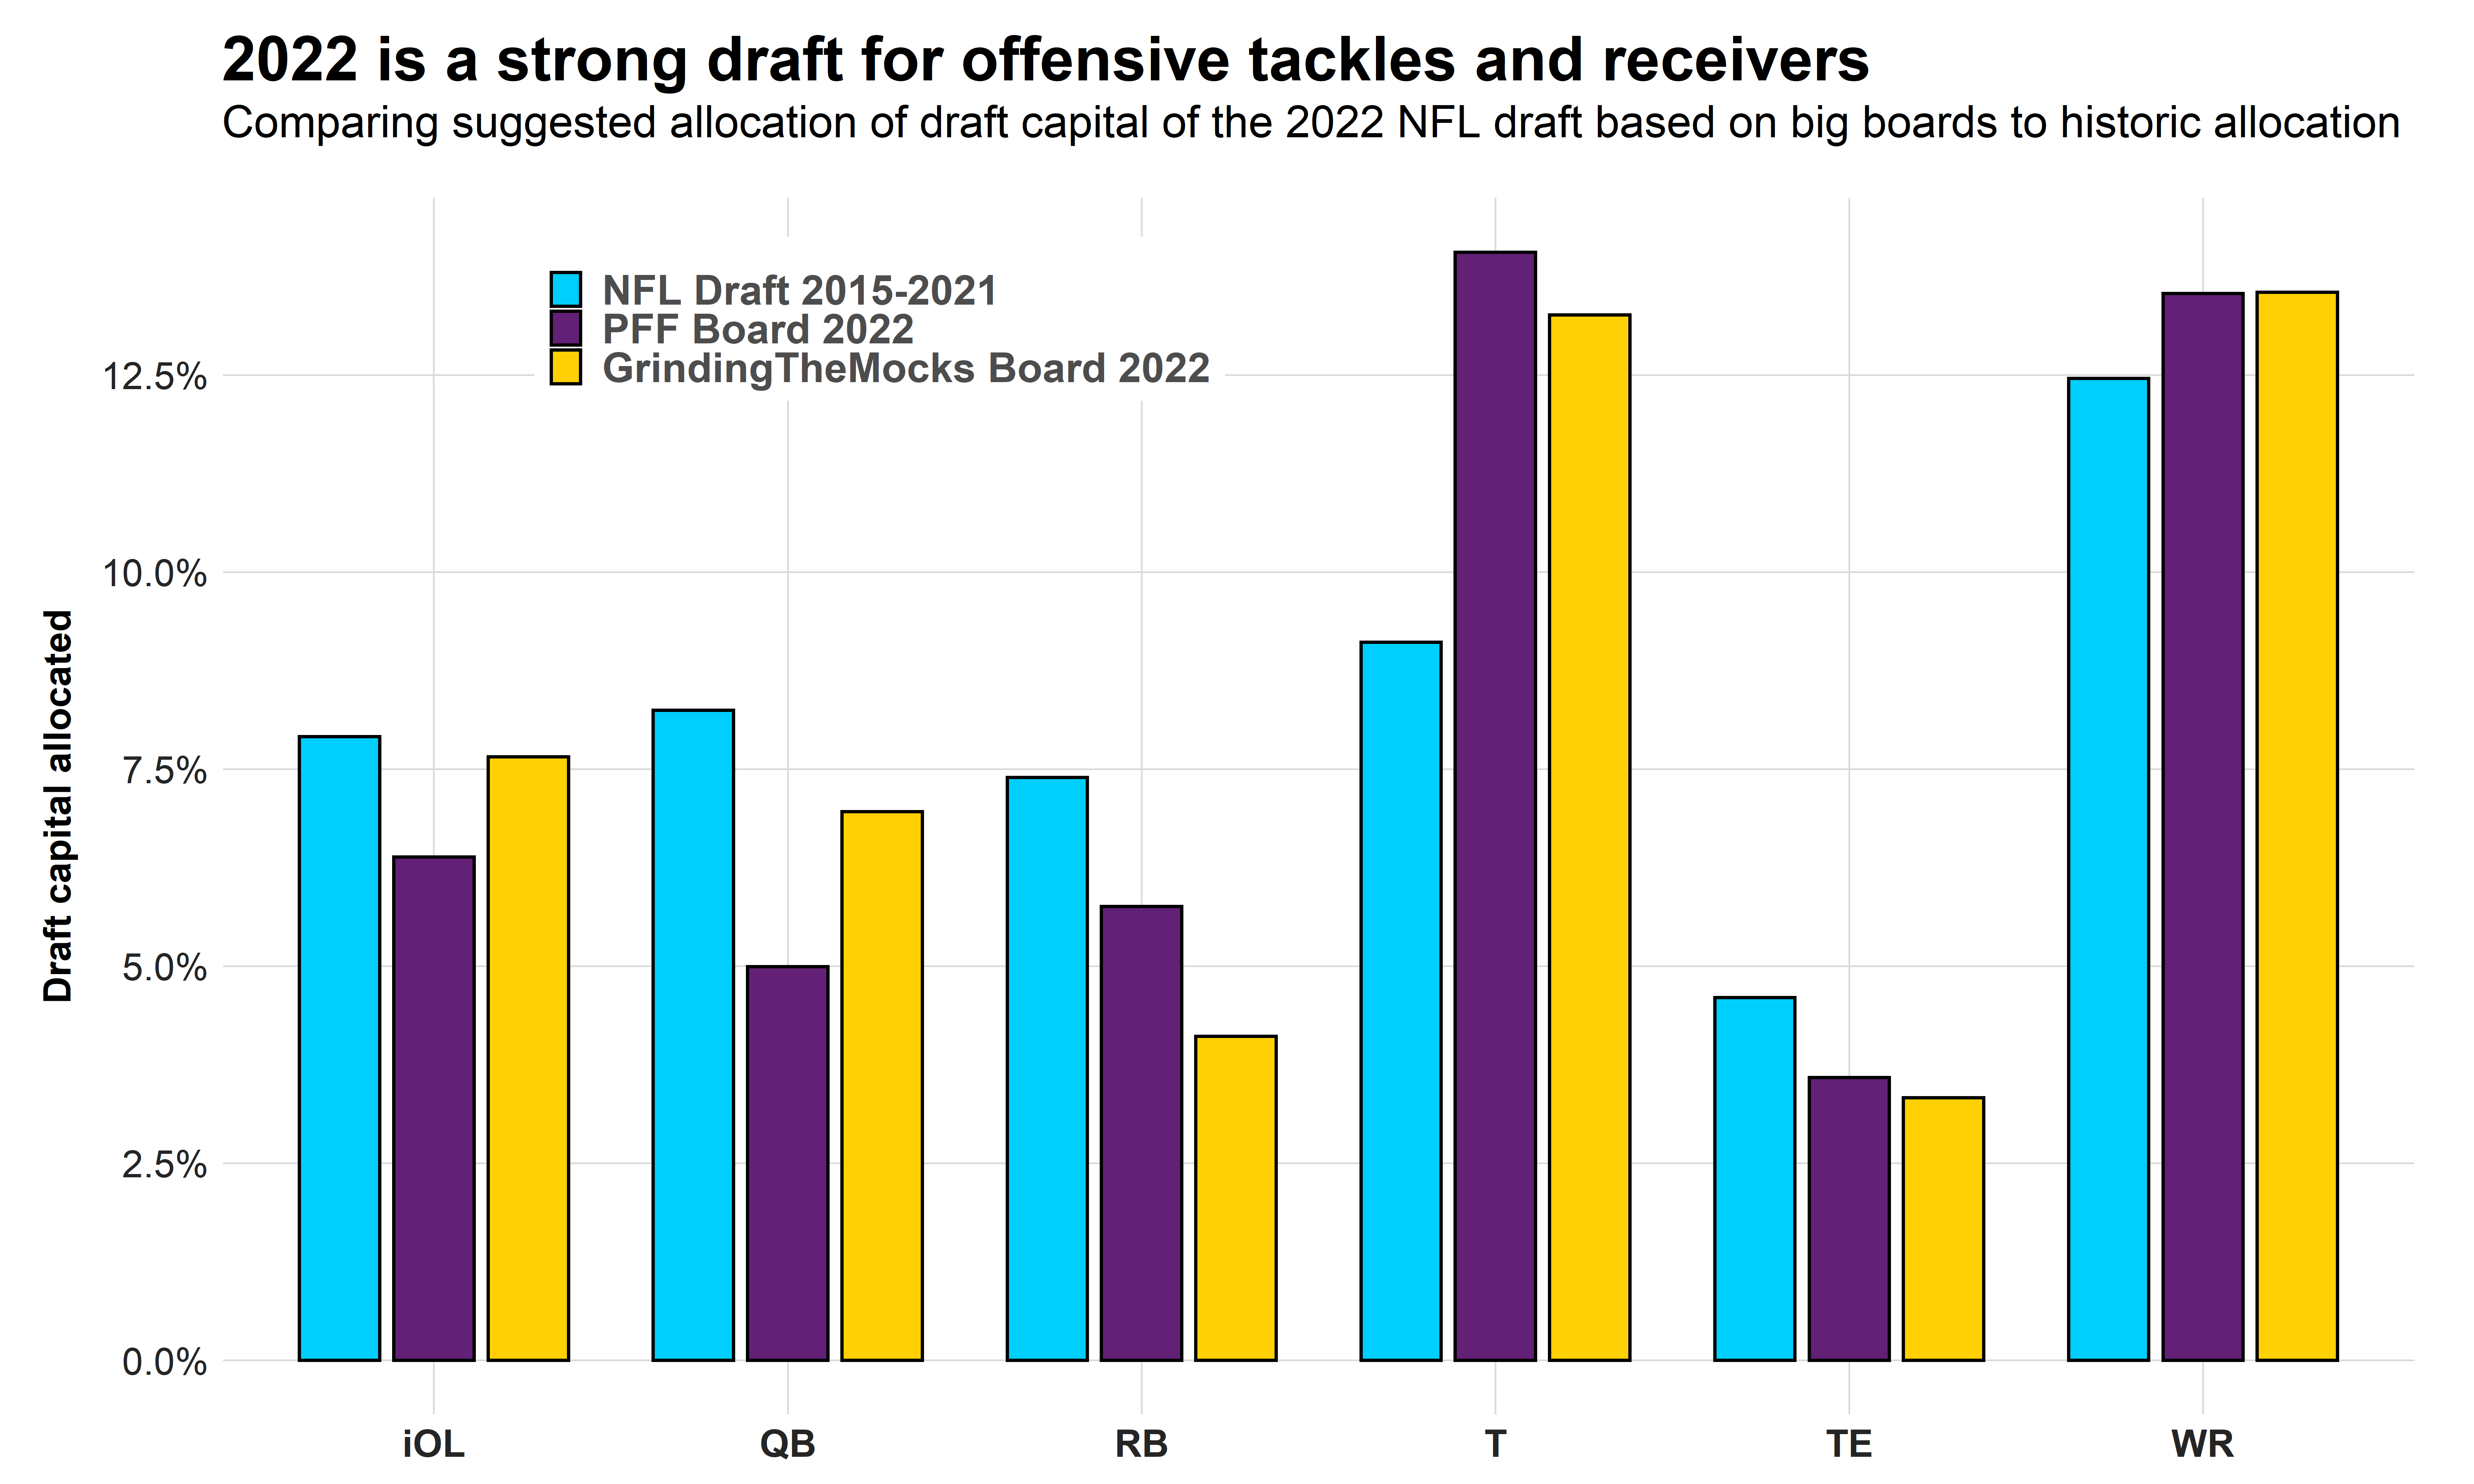
We can see that 2022 shapes up to be a very strong class for offensive tackles and a fairly strong class for wide receivers, but a weak class for quarterbacks, running backs and tight ends.
Here are the results for defensive positions.
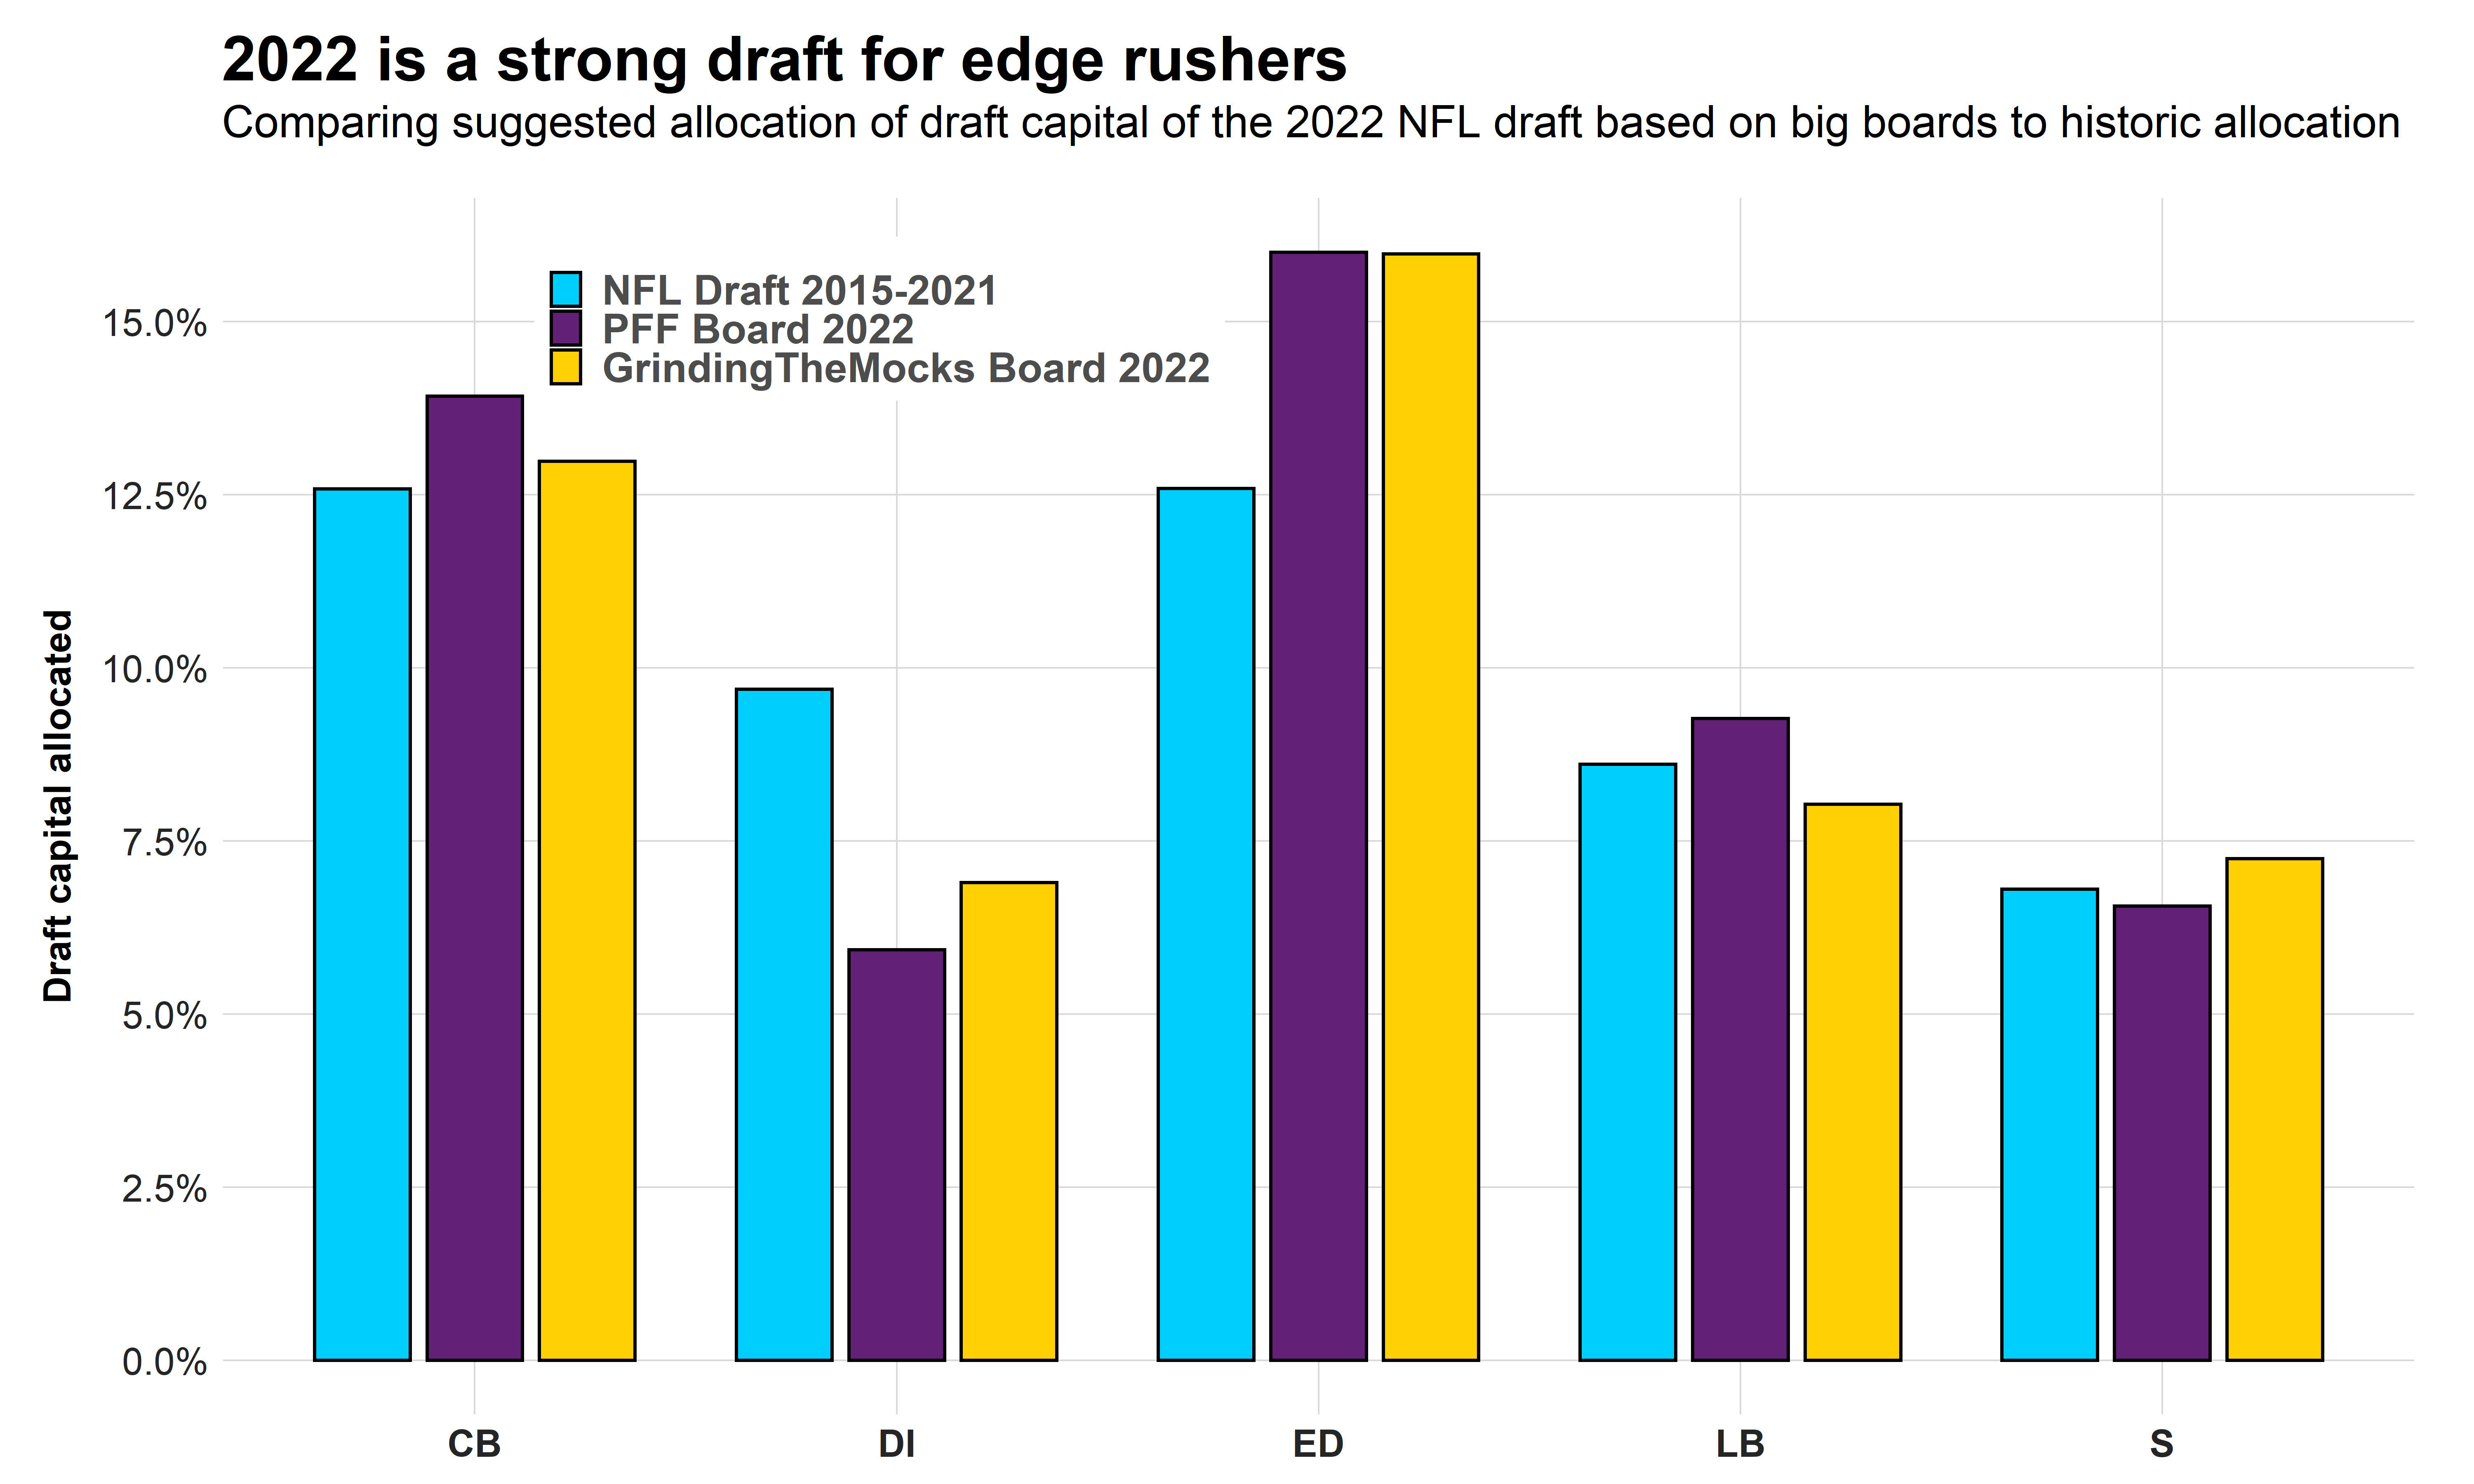
We are looking at a very strong class for edge defenders, but a weak class for interior defensive linemen.
A deeper look fuels decisions
Looking at draft capital allocated to each position gives us a first overview of the talent of each position in this year’s draft, but it can’t tell the whole story because the information above misses out on where the talent is hidden in the draft.
Using our draft value chart, the fourth and fifth overall picks combine for the same value as the 40th through 45th picks or as the 70th through 79th picks. These three alternatives would look the same in the bar charts above, but they come with very different implications for different teams in the draft. For a team selecting 12th overall, elite talent that is probably off the board after the first eight picks is mostly irrelevant, while a bunch of talent projected to be available in the 40s would be of very interesting nature for them.
To address this shortcoming, we create another visual for each position, which compares the Xth player taken of a position in historical drafts to the Xth player on the big board ranks. We start with quarterbacks and give a quick explanation of how to read the chart.
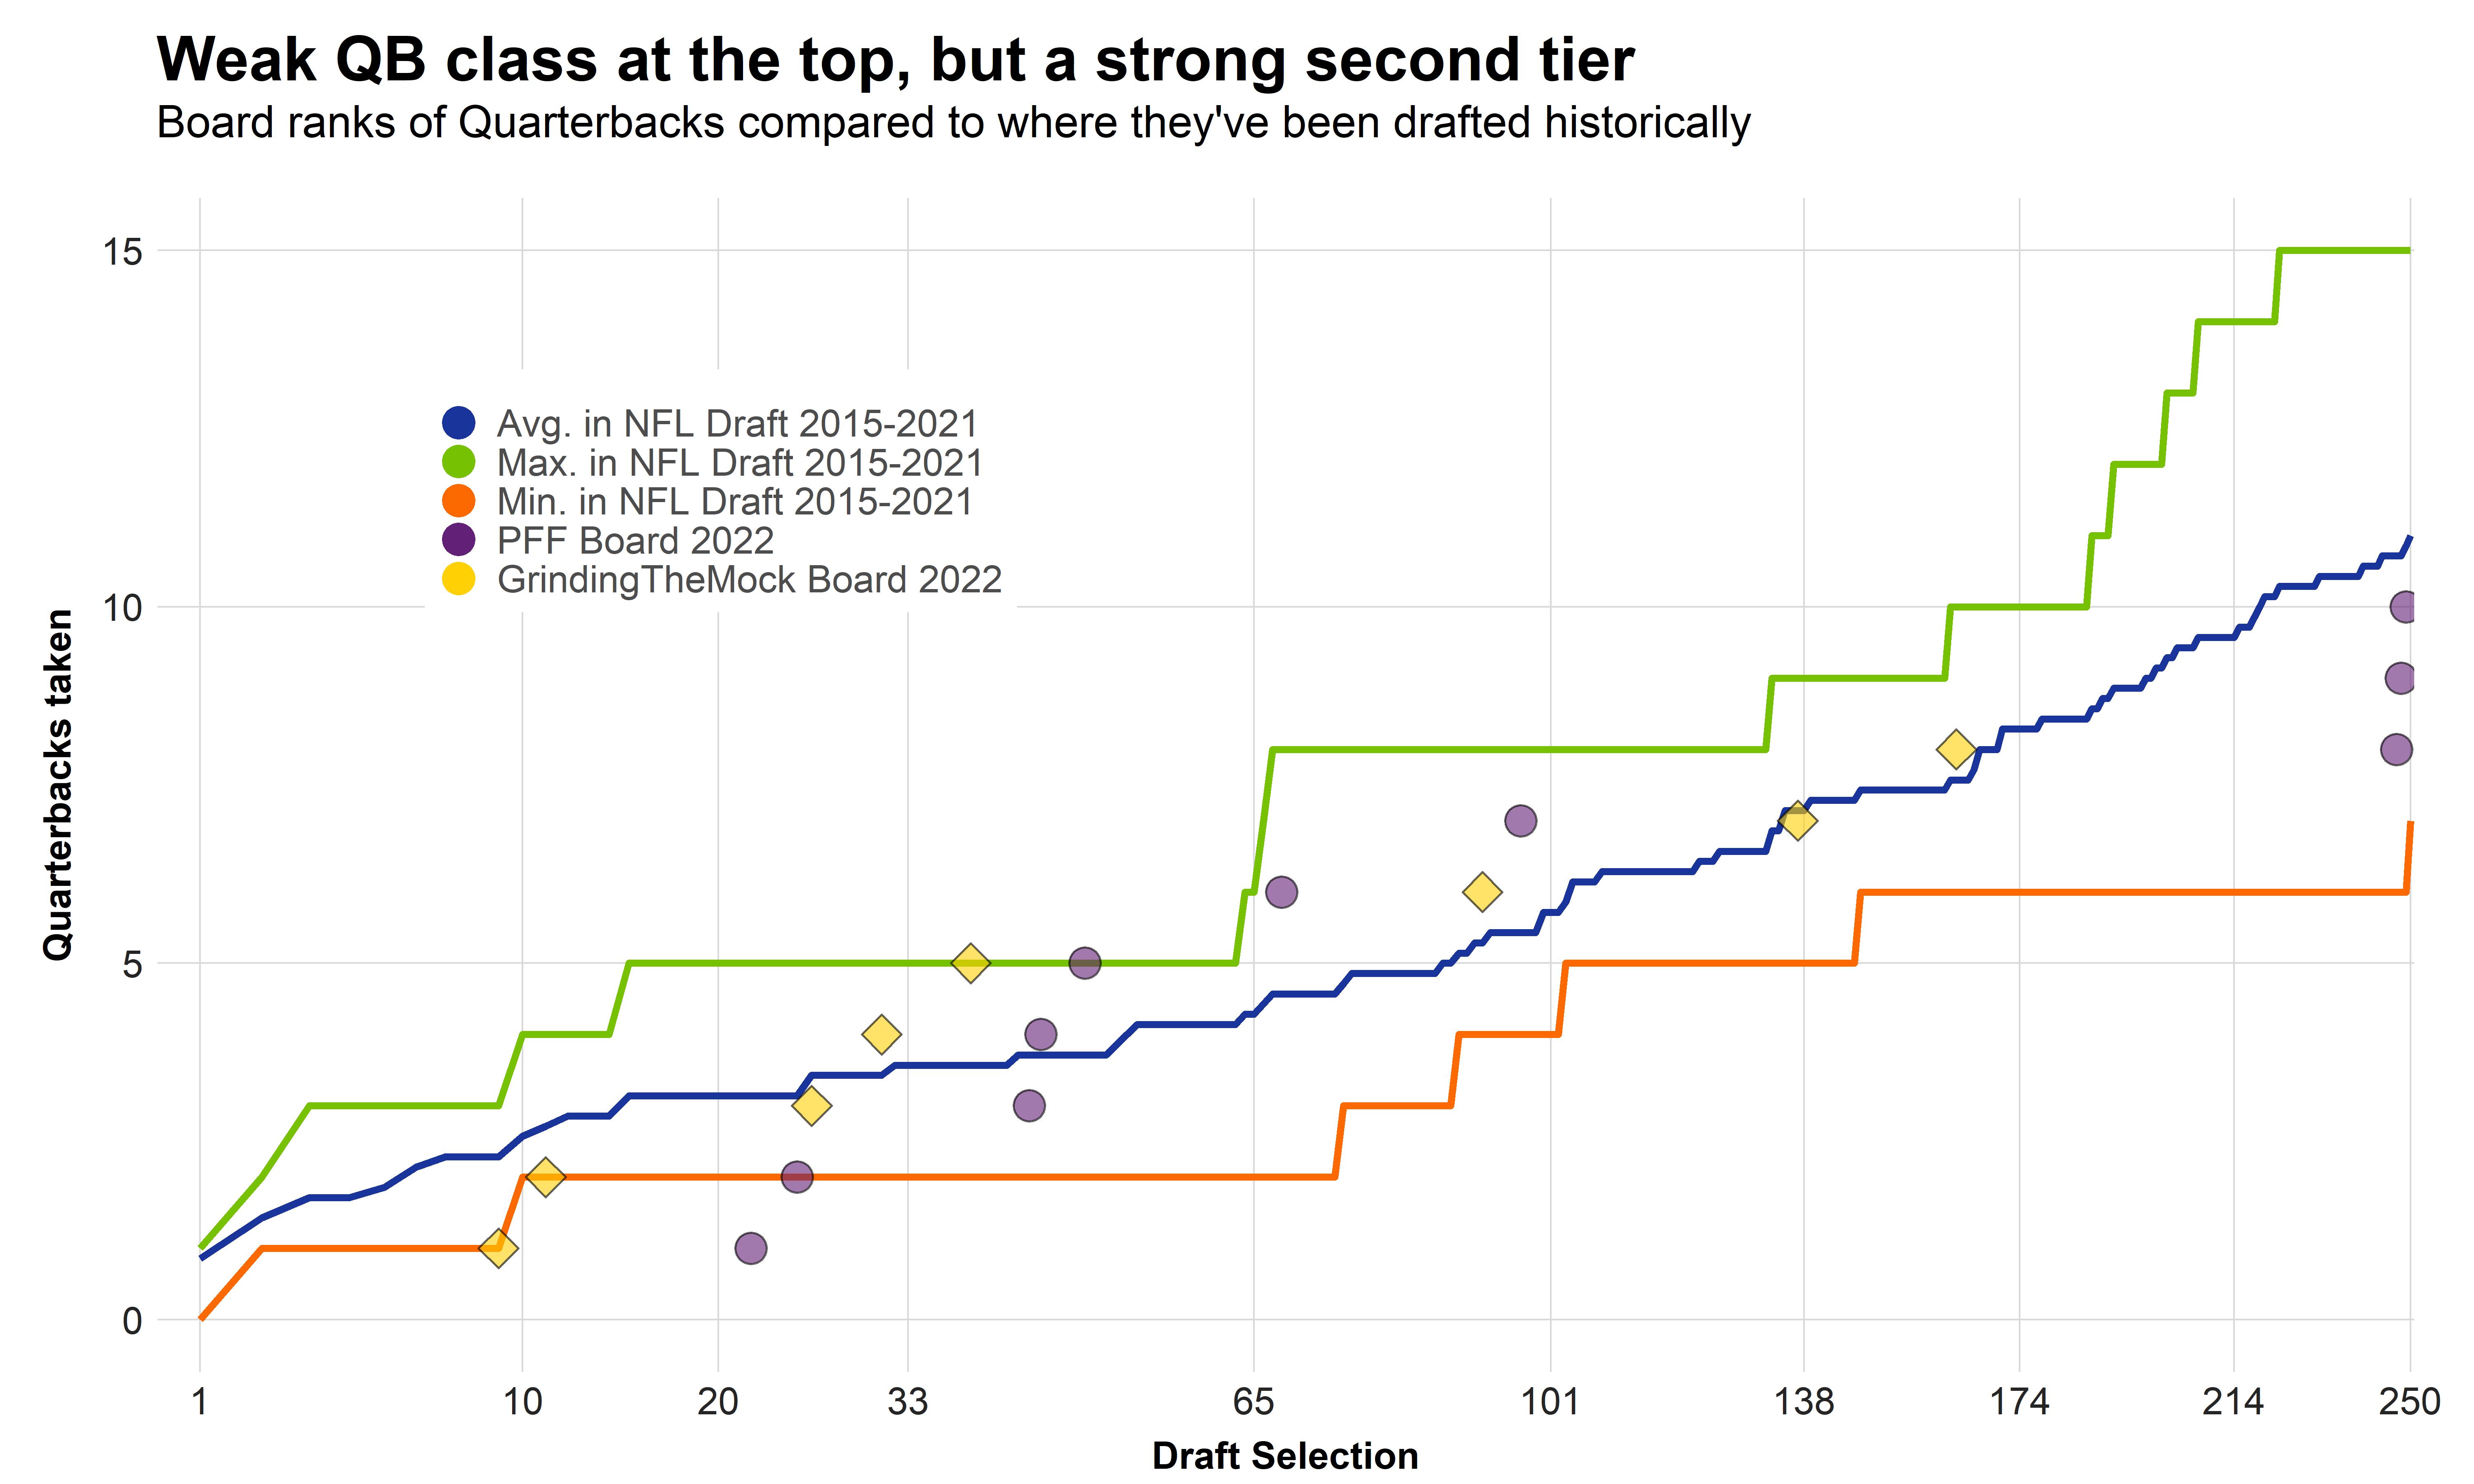
The chart consists of three lines and two different series of points. The blue (middle line) describes how many quarterbacks have been taken on average with the first X selections in the last seven drafts. The green (top) line describes the maximum of quarterbacks taken with the first X selections in the last seven drafts and the orange (bottom) line describes the minimum number.
For example, the maximum quarterbacks taken with the first 15 picks is five, as this occurred last year with Trevor Lawrence, Zach Wilson, Trey Lance, Justin Fields and Mac Jones all coming off the board early. As a polar opposite, the minimum of quarterbacks taken in the first two rounds (first 64 picks) is two, as only Jameis Winston and Marcus Mariota came off the board early in 2015. On average there have been between three and four quarterback selections in the first round.
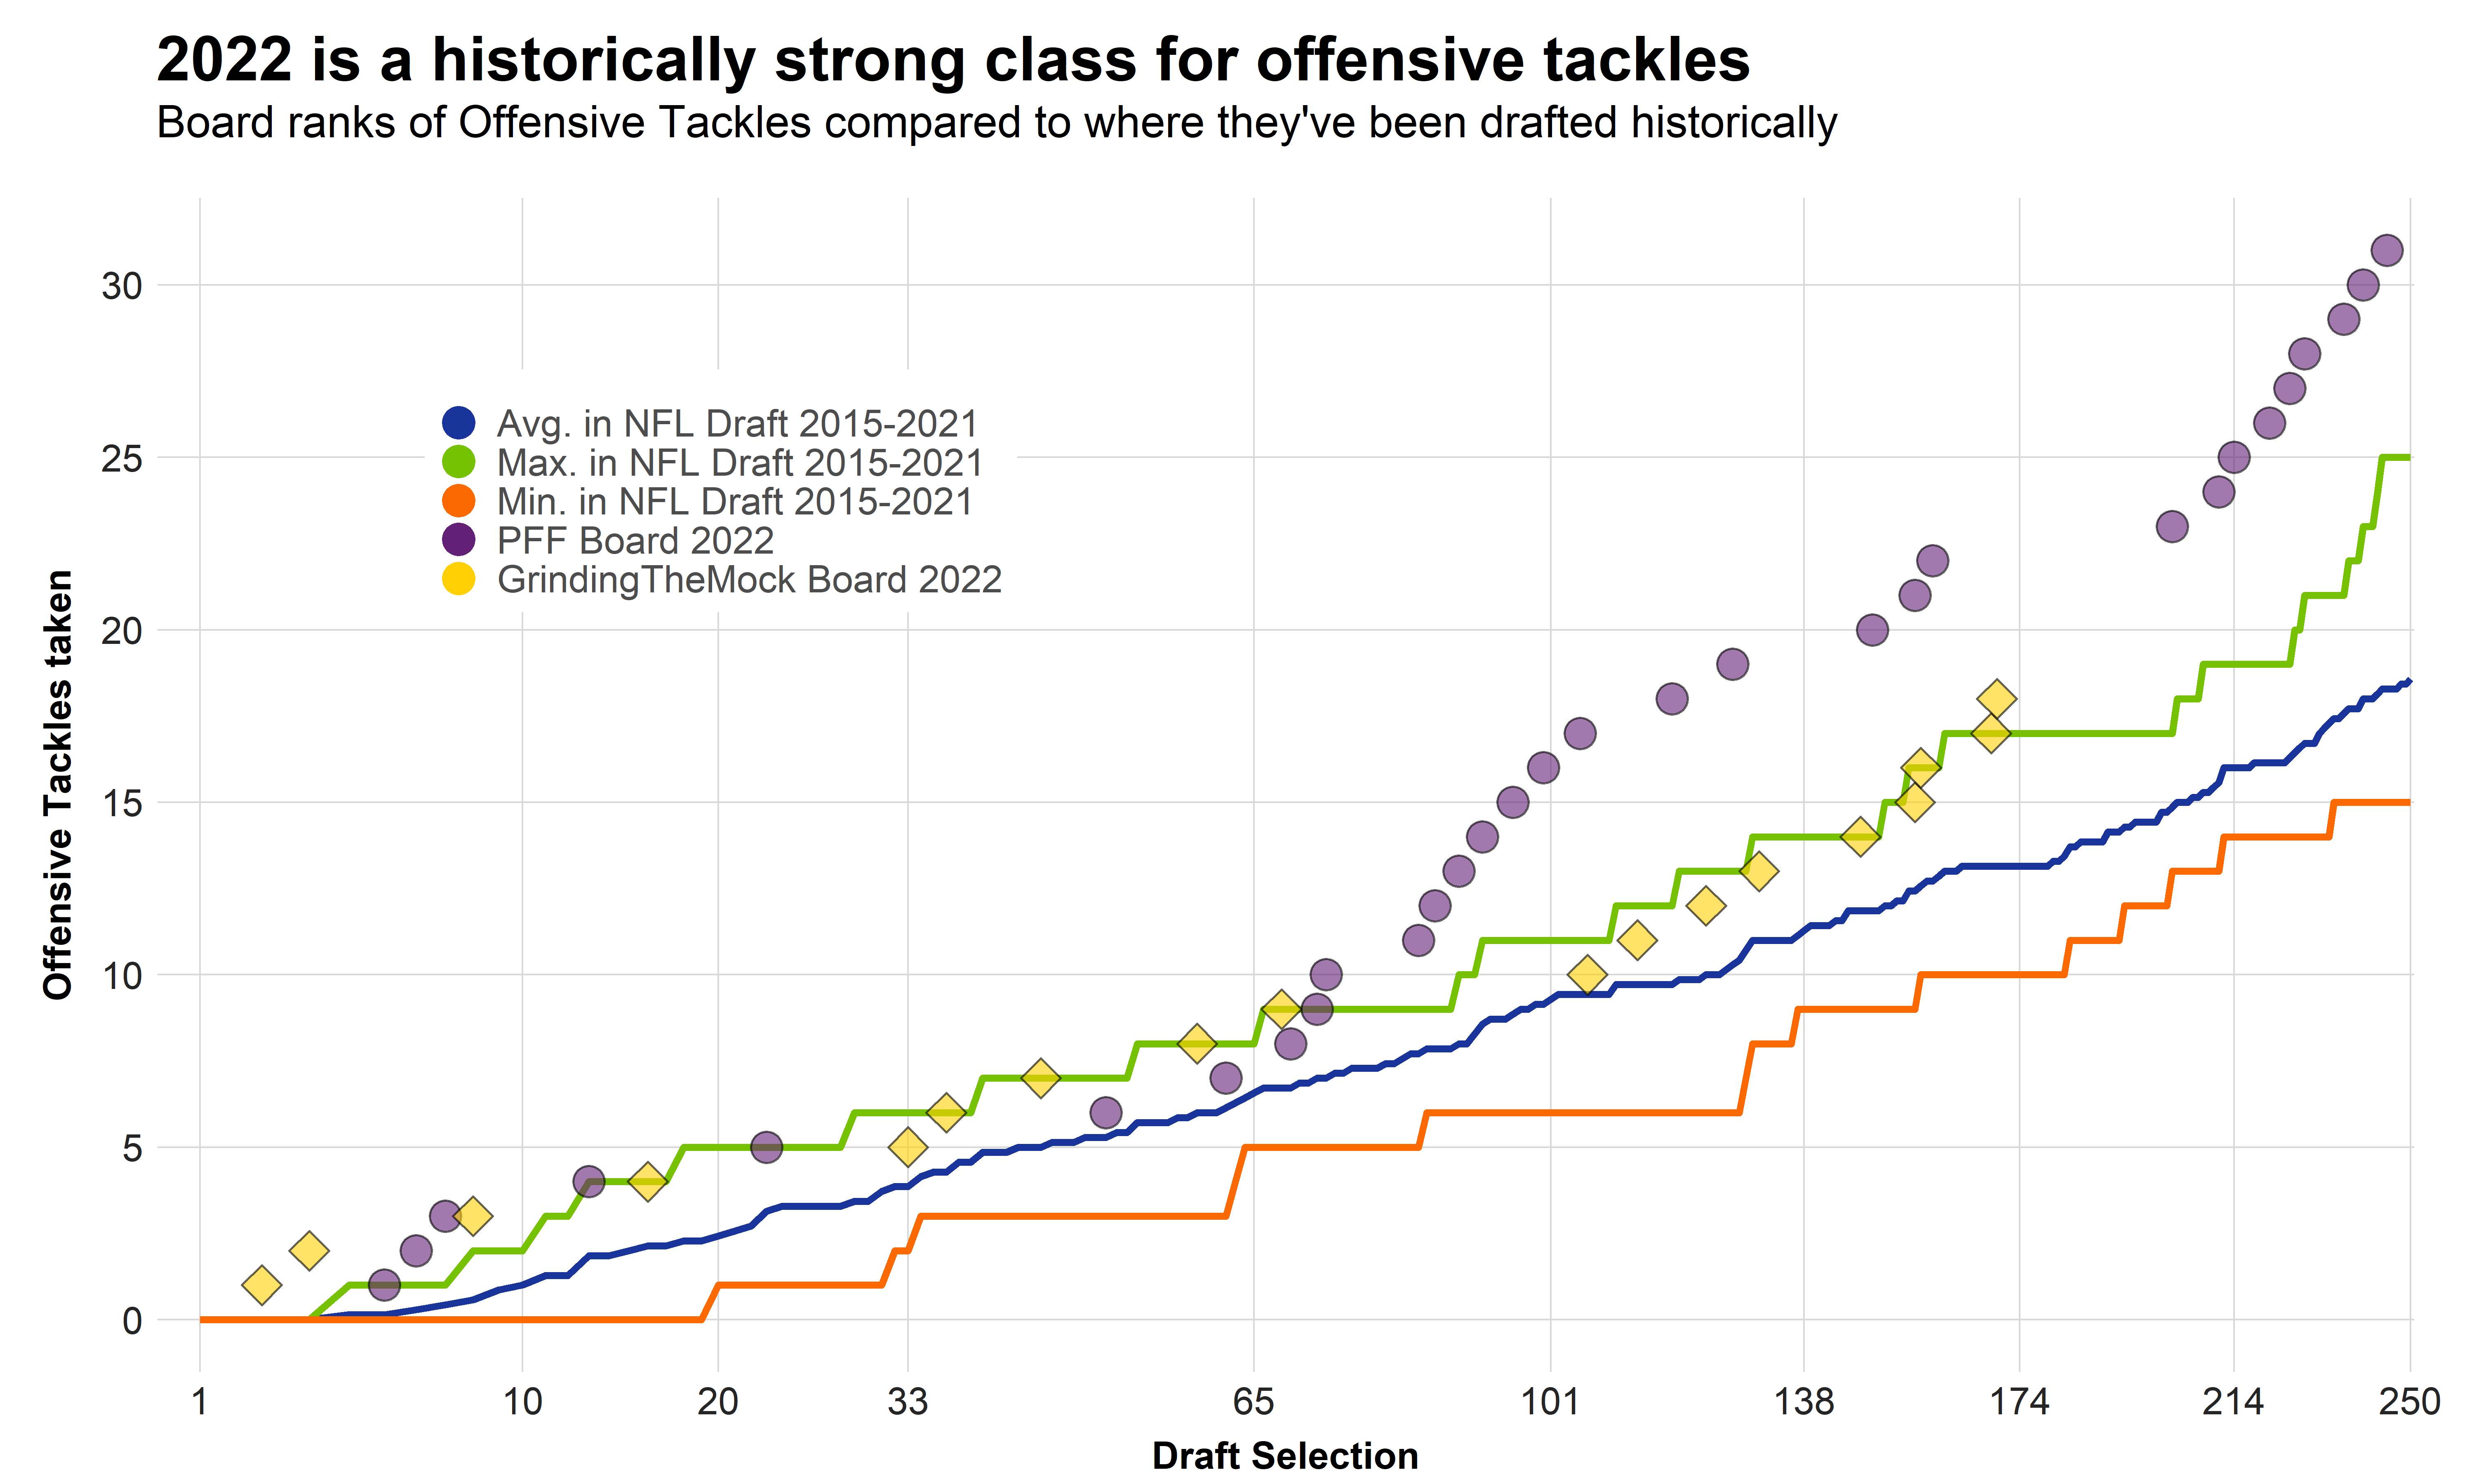
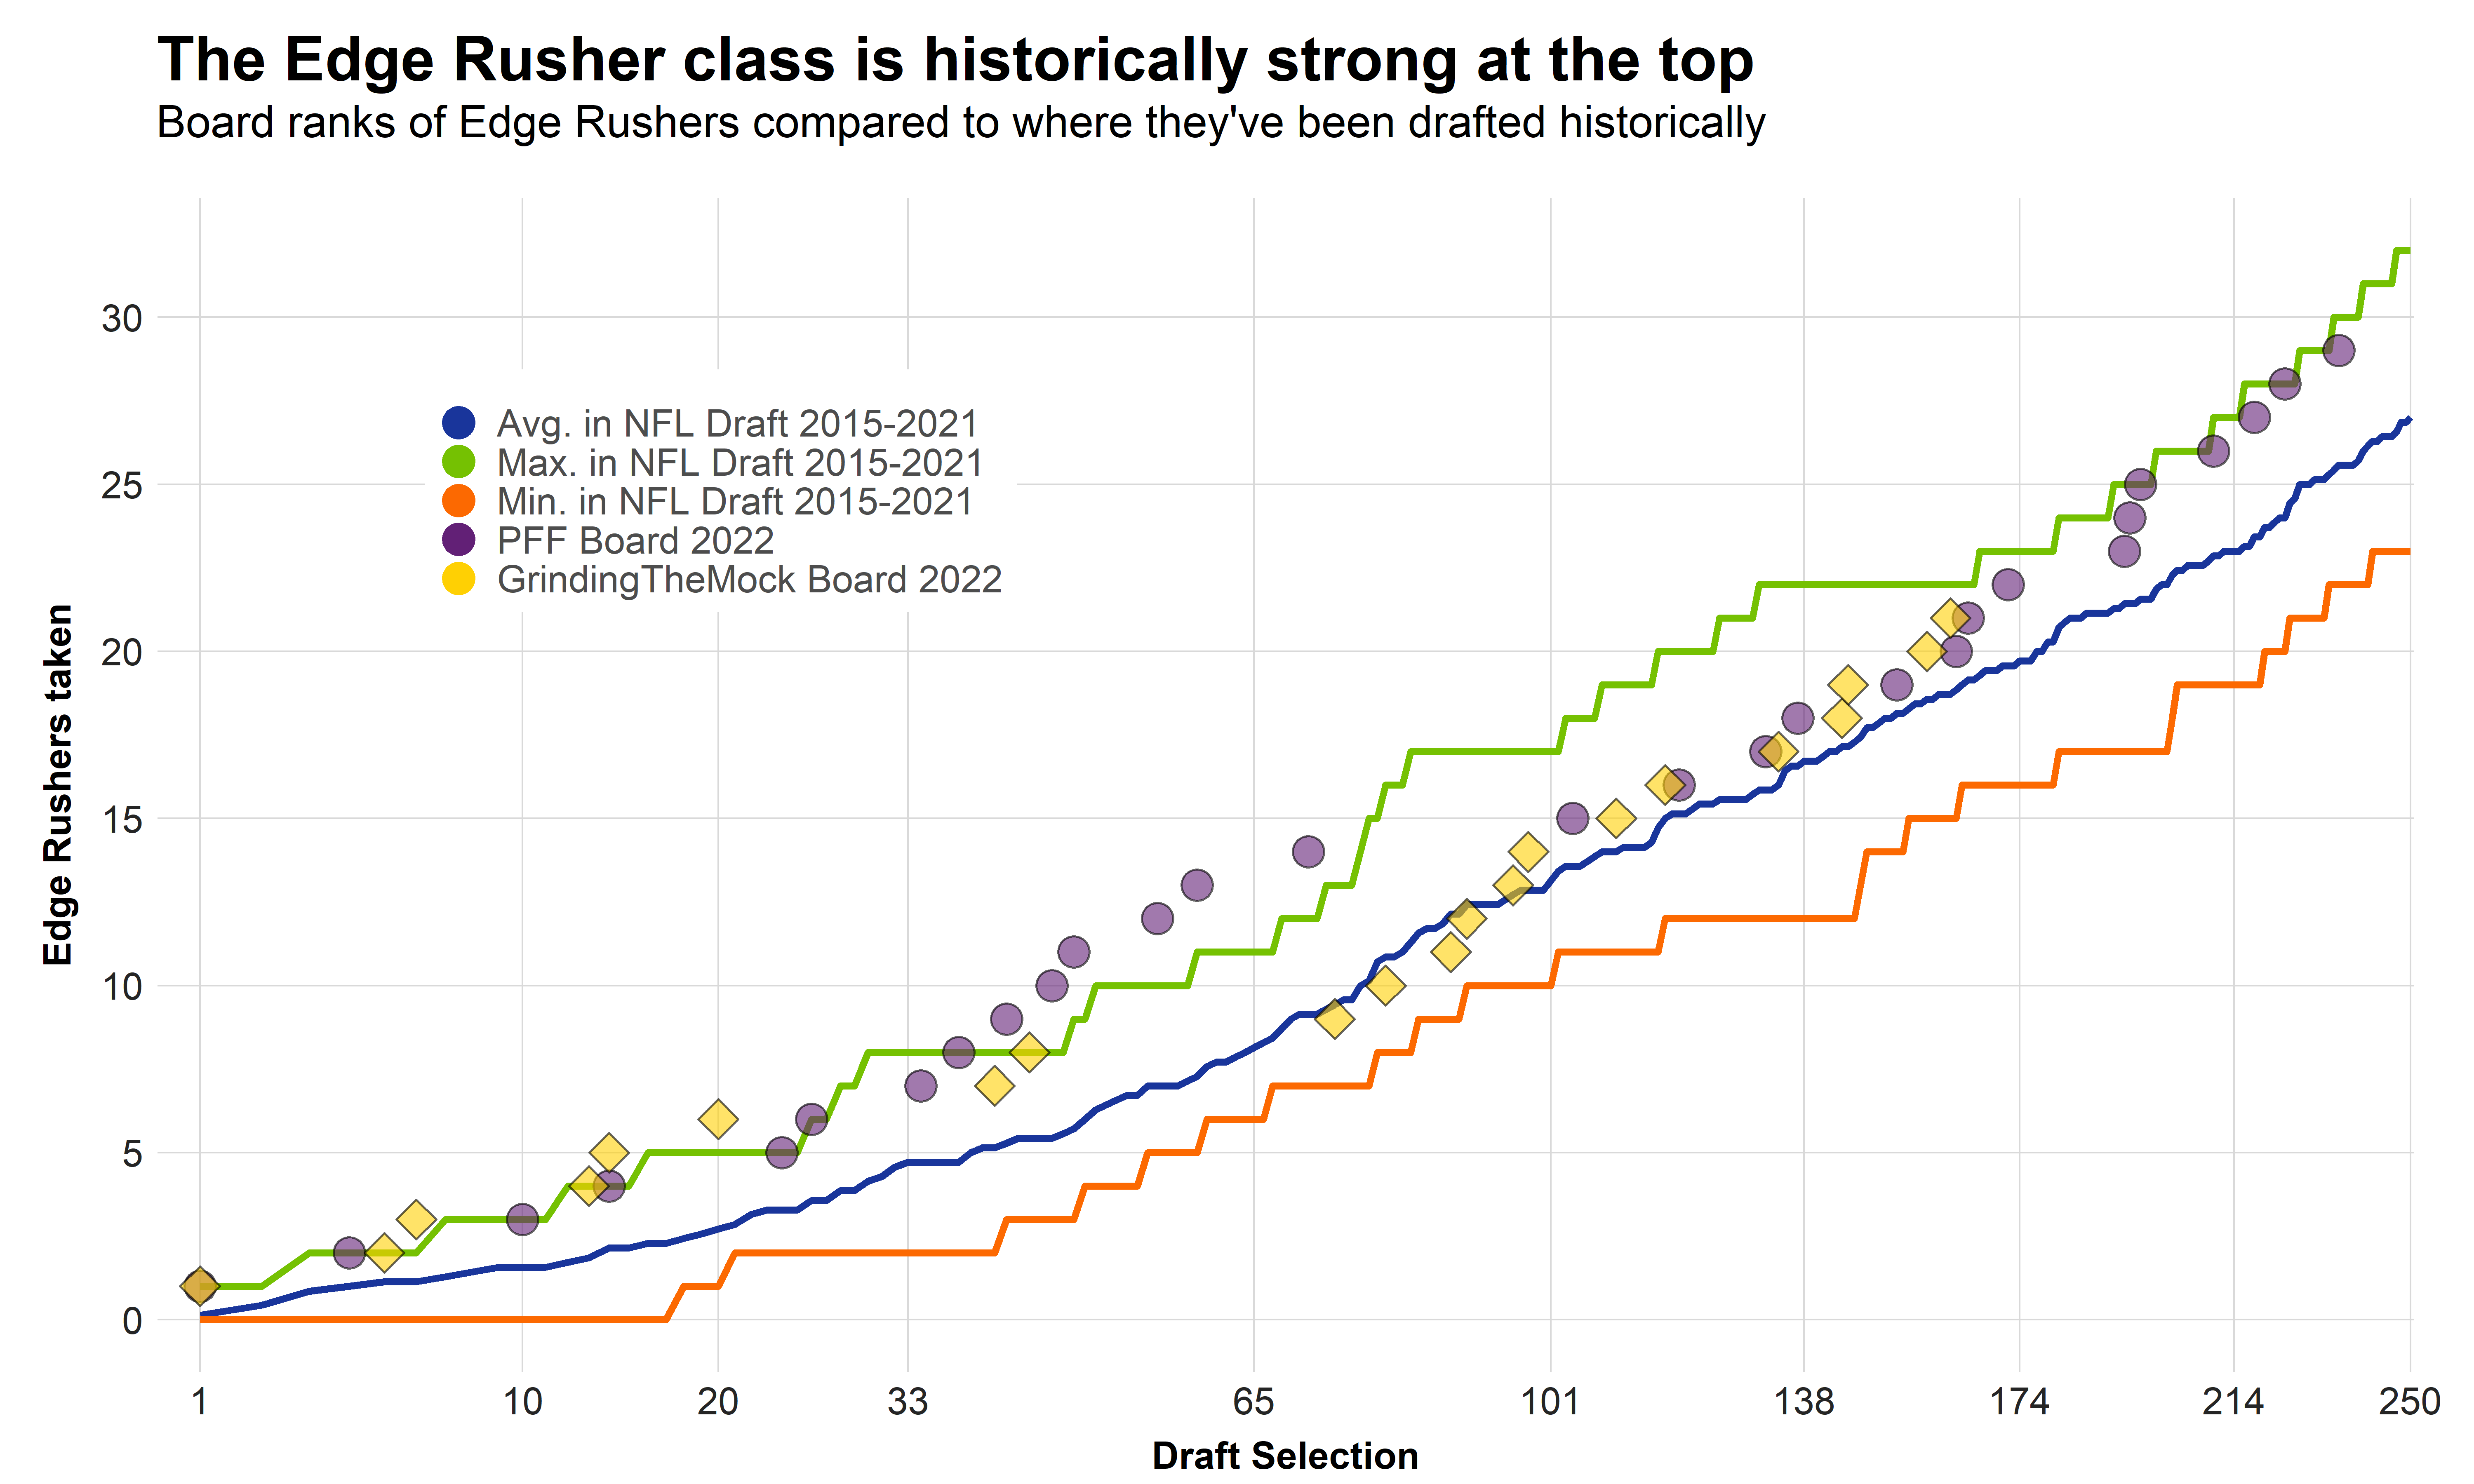
Basically, the three lines give us a mean expectation as well as a range for how many players of a position are taken through X selections. The points give us the number of players of the position through rank X of the 2022 boards. In this chart specifically, the purple (circle) points describe the board ranks of quarterbacks on the PFF big board, while the yellow (diamond) points stand for the board ranks on the public board. It’s noteworthy that the public big board currently consists of 176 players, so the yellow points stop at this point.
Loosely speaking, we can spot a weak class by points below the average line and a strong class by points above the average line. For quarterbacks, this means what many of us already know: It’s a weak class at the top, but a fairly second tier.

Strong overall: Edge and OT
We continue with offensive tackles and note that it’s one of the best offensive tackle classes in recent history all across the board.
The same can be said for edge rushers, especially in the first two rounds.
Exclusive content for premium subscribers

WANT TO KEEP READING?
Dominate Fantasy Football & Betting with AI-Powered Data & Tools Trusted By All 32 Teams
Already have a subscription? Log in


 © 2025 PFF - all rights reserved.